Introduction
In my previous blog post, we discussed a related concept called the earning yield. In there, we assumed a P/E for a stock and then went on to derive a potential return from it. In the Franchise P/E concept, we will first assume a rate of return, and from here, we will calculate a suitable P/E for the stock that will support our assumed return. In this P/E calculation, we will use the company’s fundamentals like profit, ROE, dividend, etc.
In this post, I will first explain the concept of Franchise P/E, and then I’ll show the calculations associated with this concept. Finally, I’ll also show how the result of the Franchise P/E calculation can be used to judge if a stock is currently priced or not.
Franchise P/E is one element of the formula for Full P/E. As a stock analyst, we can compare the calculated Full P/E with the current P/E to judge the valuation. After reading this post, you will be able to execute all these steps by yourself without any external help. To understand the Full P/E formula, you can also read my earlier blog post.
Explanation of The Term Franchise
Imagine a tea–samosa stall at a street corner. It is very popular. Every evening, many office people come here. It sells a lot and makes good money.
But here is the key point. All the money comes only because that stall is at that exact place.
If, the stall owner goes on leave, or the stall is moved to another street, or a similar stall opens next door, then customers can easily switch.
So, even though people remember the stall, there is nothing special that can be copied or repeated elsewhere.
That means, no brand, no unique system, no protection from competition. This is not a franchise business.
Why do high sales alone not make it a franchise?
The stall may earn Rs. 1 lakh per day. But it cannot open 100 such stalls easily. Why?
Because the taste depends on one person, there is no fixed recipe written down, no standard process, and there is no brand name people search for.
So, for such a business, growth is limited.
This is a good business, but not a franchise.
So, can such a tea stall become a franchise business?
To understand this, now imagine the owner doing the following things:
- Creates a fixed recipe so that tea tastes the same everywhere
- Uses a brand name like “Chai Junction.”
- Trains others to run the stall the same way
- Ensures the same cups, the same taste, the same experience
- Opens stalls in many locations using the same system
What is the objective of doing all these things? The purpose is to make the customers say: “I want tea from this brand, not just any tea stall.”
At this point, a simple tea-selling business is getting transferred into the following:
- The business can grow without the owner being present
- Competitors can’t easily copy it
- Each new stall adds more value
This is what a franchise business model is. Two points to remember here:
- Popularity ≠ Franchise
- Repeatability + Protection = Franchise
Now that we have understood the significance of the term “Franchise,” we’ll now see how to calculate the franchise P/E for a company (stock).
In the next section, we’ll discuss in detail how to calculate the Full P/E and the Franchise P/E. For a more relatable experience, I’ve used two real-life companies: Maharashtra Seamless (low P/E stock) and Polycab (high P/E stock).
So let’s start.
How to calculate the franchise P/E for a company (stock)?
Franchise P/E is an element of the Full P/E equation. I’ve discussed the Full P/E equation in my earlier blog post. To get a feel of this equation, I’ll suggest that you read that post before proceeding.
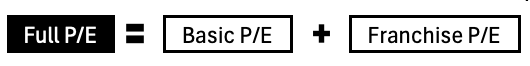
The Full P/E formula has two components:
- Basic P/E, and
- Franchise P/E
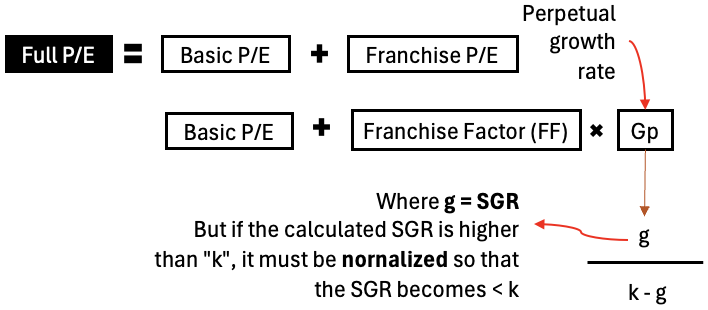
- Full P/E = Basic P/E + Franchise P/E
The breakdown of the Full P/E Formula looks like below:
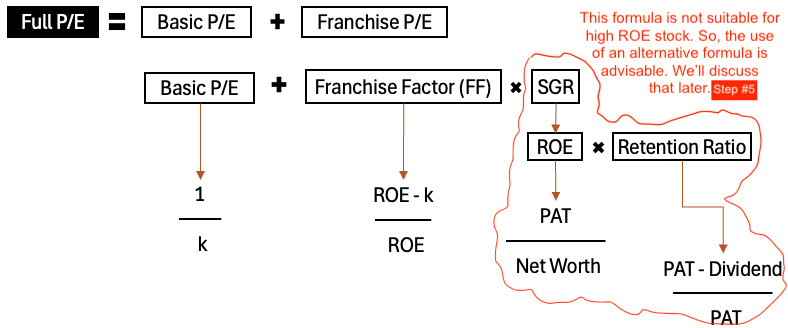
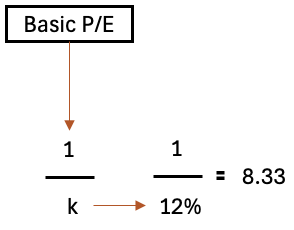
Basic P/E
To calculate Full P/E, what we need is a component called ‘k.’ This “k” is nothing but the cost of equity or the expected return of the shareholders. In India, a person who is not investing in risk-free options like a debt fund or a fixed deposit expects a return which is a minimum of 12% per annum. So for our calculation purposes, we’ll assume “k” as 12%.
It is not necessary to assume a value of 12% for ‘k,’ you can also assume sub or above par values. But what is essential here is to assume a value that complements your expected return for the stock. If your expected return is 15%, then for you, the value of k=15% will be a suitable choice.
Similarly, some people would accept even a 10% long-term return from their stock. So, for them, the suitable value will be k=10%.
As an analyst, we can also assume multiple ‘k’ values to see how it affects the Full P/E equation.
The thing is, there is no fixed value of ‘k,’ but the point is, as we are analyzing a stock, our expected returns should be above the risk-free rate (generally). Currently, the risk-free rate is approximately 6.6% (yield of a 10-year government bond in India).
For both our example stocks, Maharashtra Seamless and Polycab, I’ve assumed a cost of equity of 12%.

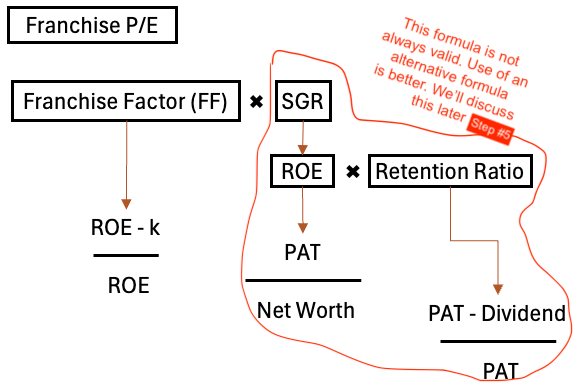
Franchise P/E
What is Franchise P/E? It is the extra reward a business gets because it has the characteristics of a franchise business.
To earn extra value, a franchise business must display two things at the same time.
- First, the business must make extra returns. This is captured by the Franchise Factor (FF). FF answers this question: “Does this company earn more than what investors expect?” If a company earns only the expected return, it has no franchise power. One strong indicator of a franchise business model is high ROE. When the ‘ROE’ is higher than our expected return on investment (cost of equity), only then can a business be said to be a franchise.
- Second, the business must also be able to grow using that advantage (high ROE). This ability to grow is captured by the Sustainable Growth Rate (SGR). SGR answers the question: “How much can the company actually expand using its franchise?”
What does it mean? It means the following:
- A company with high returns (ROE) but no growth (SGR) cannot create much extra value.
- Similarly, a company with growth (SGR) but no extra returns (ROE) also creates no extra value.
Franchise P/E exists only when both work together: high returns (FF), which is a factor of ROE × ability to grow (SGR).
How To Calculate Franchise P/E
It is a multi-step process, and in this post, I’ll show you all the steps in its right order.
Calculation Steps
Step #1: We’ll calculate the Return on Equity (ROE)
To complete the calculation, we’ll need three metrics: Net Profit (PAT) and Networth (or Total Shareholders’ Value, also called Equity of the stock).
For our example companies, these are the following values: we’ll consider for ROE calculation
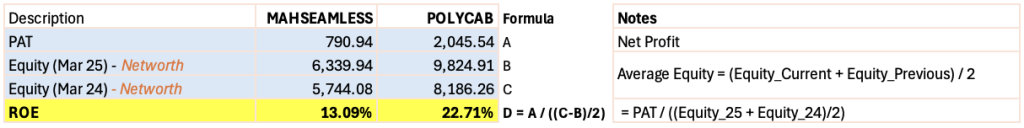
- Net Profit (PAT): 790.94 Crore (Maharashtra Seamless) and 2,045.54 Crore (Polycab)
- Networth or Equity for FY Mar’25: 6,339.94 Crore (Maharashtra Seamless) and 9824.91 Crore (Polycab)
- Networth or Equity for FY Mar’24: 5,744.08 Crore (Maharashtra Seamless) and 8,186.26 Crore (Polycab)
With these values, we can calculate the Average Equity for both companies. For Maharashtra Seamless, it will be 6,042.01 Crore. For Polycab, it will be 9005.59 Crore.
Now, we are ready to calculate the ROE using this common formula. ROE = PAT / Average Equity)
So, this way, the ROE for Maharashtra Seamless and Polycab will be 13.09% for Maharashtra Seamless (790.94 / 6042.01) and 22.71% for Polycab (2045.54 / 9005.59).
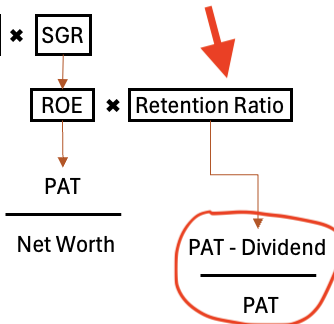
Step #2: We’ll then calculate the Retention Ratio
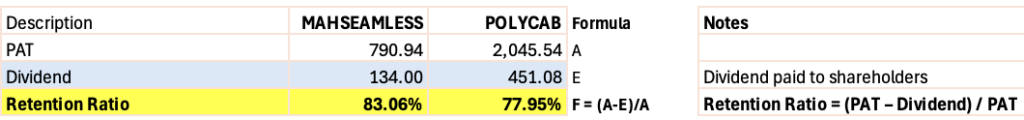
Retention is the ratio between the company’s Retained Earnings and its Net Profits (PAT). In terms of formula, the Retention will look like = (PAT – Dividend) / PAT. To know more about retained earnings, you can also read my detailed blog post on this topic.
For our example stocks (Maharashtra Seamless and Polycab), the values that will be used for the retention ratio calculation are as follows:
As we know, the Net Profit (PAT) will be 790.94 crore and 2,045.54 crore for the two companies, respectively.
The dividend distributed to the shareholders in the FY ending March’25 is 134 Crore for Maharashtra Seamless and 451.08 Crore for Polycab.
This way, the earnings (net profit) that is retained by both companies after distributing dividends are as follows:
- Retained Earnings (Maharashtra Seamless): 656.94 Crore
- Retained Earnings (Polycab): 1,594.46 Crore
With these values in our hands, we can now calculate the retained earnings for both companies using the formula Retained Earnings / PAT.
This way, the retention ratio for Maharashtra Seamless and Polycab comes out as 83.06% and 77.95% respectively.
What does it mean? It means that, out of all the profits generated by both companies, Maharashtra Seamless retained more as compared to Polycab.
Note the difference in the characteristics of both companies:
| Description | Maharashtra Seamless | Polycab |
| Net Profit (PAT) | Lower | Higher |
| ROE | Lower | Higher |
| Retention Ratio | Higher (retains more profits) | Lower (Pays more dividends) |
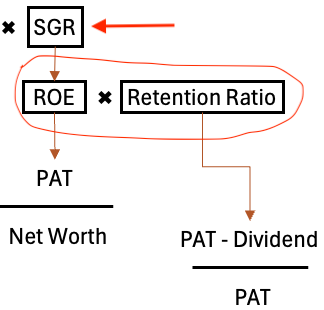
Step #3: Calculate Sustainable Growth Rate (g)
What is Sustainable Growth Rate (SGR)? It is the maximum growth rate at which a company can grow its profits. Why is it called sustainable growth? Because here the company is using only its retained earnings (PAT – Dividend) to grow, it is neither taking debt nor raising capital through the equity route.
What is the company doing? It is just making sure that it is making enough net profits so that a part of it can be used to pay dividends, and the majority of it (like 83% or 78%) can be reinvested back into the company’s operations.
The reinvested money can be used for growing revenue (expansion projects), improving efficiency (modernization projects), repayment of debt (margin improvement), acquisition of new businesses (market share growth), etc.
In terms of formula, SGR = ROE x Retention Ratio
For our two example companies, we already have both the values ready to perform the SGR calculation. The ROE is 13.09% (Maharashtra Seamless) and 22.71% (Polycab). We also know that the retention ratio is 83.06% (Maharashtra Seamless) and 77.95% (Polycab).
So, applying these values to the SGR formula of = ROE x Retention Ratio:
| Description | Maharashtra Seamless | Polycab |
| ROE | 13.09 | 22.71 |
| Retention Ratio | 83.06% | 77.95% |
| SGR | 10.87% | 17.7% |
Step #4: Calculate Franchise Factor (FF)
A franchise business model will always have a high ROE. What is a high ROE? When the ‘ROE’ is higher than the investor’s expected return on investment, it becomes a franchise business.
Suppose, as an investor, your expected return on investment from a stock is 12%. In this case, the stock’s ROE must necessarily be higher than 12% to make it a franchise model.
In terms of formula, the franchise factor (FF) is equal to (ROE – k) / ROE.
The delta (difference) between the ROE and K is what builds the franchise factor for the company. The bigger the delta, the higher the valuation the company can claim from its investors.
Let’s see how the differential between ROE and “k” creates the difference in Franchise Factor (FF) multiple of our example companies.
Note:
- Expected Return (k) = 12%
- ROE (Maharashtra Seamless) = 13.09%
- ROE (Polycab) = 22.71%
- Delta (Maharashtra Seamless) = 1.09% (13.09 – 12)
- Delta (Polycab) = 10.71% (22.71 – 12)
Note the substantial difference in the delta of Maharashtra Seamless and Polycab. There is no doubt that the franchise factor (FF) of Polycab will be far higher. So, let’s now quantify the difference between the two companies.
| Description | Maharashtra Seamless | Polycab |
| Delta | 1.09% | 10.71 |
| ROE | 13.09% | 22.71% |
| Franchise Factor (FF) | 0.0833 (8.33%) | 0.4717 (47.17%) |
Step #5: Calculate Perpetual Growth Rate (Gp)
Perpetual Growth Rate is the growth rate at which a company can grow forever.
For low ROE Companies, when the calculated SGR is less than K, we can assume Gp = ROE x Retention Ratio.
But for high ROE Companies, when the calculated SGR is greater than K, the Gp = ROE x Retention Ratio cannot be used. Why? Because in the real world, no company can grow faster than its cost of equity forever.
What is wrong when SGR is very high?
If ROE and retention are very high, ROE × Retention (SGR) can become greater than k.
In such a scenario, the valuation explodes unrealistically. The math may be correct, but it breaks economic logic. In such a situation, we are assuming an infinite value creation. This is not a practical assumption. No company can grow at a high rate for perpetuity.
This is where we need to introduce an alternative formula that can be used for all conditions (ROE >k and ROE < k)
So, let’s see the calculation of Gp (perpetual growth rate) for our two example companies.
| Description | Maharashtra Seamless | Polycab |
| k | 12% | 12% |
| SGR | 10.87% | 17.71% |
| Is SGR > or = k? | No | Yes |
| Normalized SGR (g) | 10.87% (=SGR) | 11.4% (=95% of k) |
| Gp | 9.65 | 19 |
Step #6: Calculate Franchise P/E
At this stage, the calculation of Franchise P/E becomes rather simple. We need to simply apply the calculated Franchise Factor (FF) and Perpetual Growth Rate (Gp) to arrive at the multiple.
We know:
Franchise P/E = Franchise Factor (FF) x Gp
For our two example companies, Maharashtra Seamless and Polycab, the Franchise P/E will be as shown below:
| Description | Maharashtra Seamless | Polycab |
| Franchise Factor (FF) | 8.33% | 47.17% |
| Gp | 9.65 | 19 |
| Franchise P/E | 0.80 | 8.96 |
Step #7: Full P/E and Conclusion
To calculate the Full P/E of a stock, we need two elements: the Base P/E and the Franchise P/E
Full P/E = Base P/E + Franchise P/E
Let’s calculate the Full P/E for our two example companies:
| Description | Maharashtra Seamless | Polycab |
| Base P/E | 8.33 | 8.33 |
| Franchise P/E | 0.8 | 8.96 |
| Full P/E | 9.14 | 17.3 |
| Actual P/E | 11.93 | 43.90 |
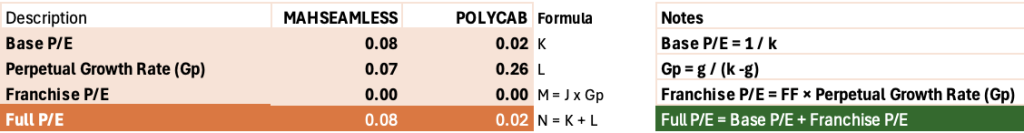
The calculated Full P/E of Maharashtra Seamless is 9.14. This is almost equal to the Base P/E of 8.33 because the Franchise P/E component is only 0.8. It is a clear signal that Maharashtra Seamless does not enjoy the benefits of a Franchise business model.
Maharashtra Seamless operates in a commodity-driven steel pipe business with cyclical demand. This limits its pricing power and low differentiation. Hence, making excess returns (high ROE) hard to sustain or scale.
On the other side, Polycab has a strong brand recall, wide distribution, and pricing power. These factors make Polycab enjoy a consistently high ROE. They also enjoy scalable reinvestment opportunities, allowing them to grow profitably over time. This is resulting in a large franchise premium for Polycab as compared to commodity businesses like Maharashtra Seamless.
But you can also see the actual P/E Maharashtra Seamless is 11.93, and that of Polycab is 43.9.
Based on our calculated Full P/E, Maharashtra Seamless’s actual P/E is overvalued by 30% but Polycab’s P/E is overvalued by 154%.
So, thought Polycab looks like a better franchise model business, but for investors, its price is very overvalued.
Have a happy investing.
Please note: In my earlier blog post, I explained the concept of Earning Yield, which is also indirectly related to this topic of Franchise P/E. I’ll suggest that you also read that post. We can use the concept of earning yield to approximately judge what kind of future return is expected from a stock.
Please wait for my next article. You can also subscribe to my newsletters and get notifications of a new post right into your inbox.
Download: You can download the Franchise P/E infographics from here.