Introduction
Stock investors often quote P/E ratio as a number that explains everything.
But anyone who has tried valuing a high-growth company knows that a simple multiple can rarely tell the full story about the company’s valuation. Some firms deserve high P/Es, others always trade at lower multiples, and a few trades at a high P/E only awaiting a price crash.
For example, Polycab invaribly trades at 40x and Maharashtra Seamless close to 10x multiples.
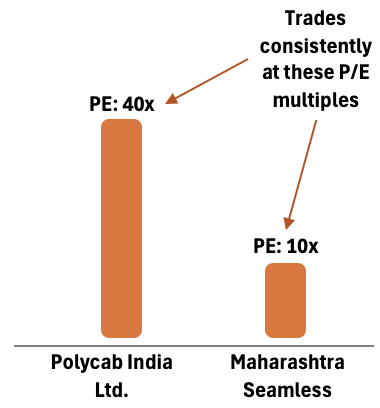
What is the rational behind it?
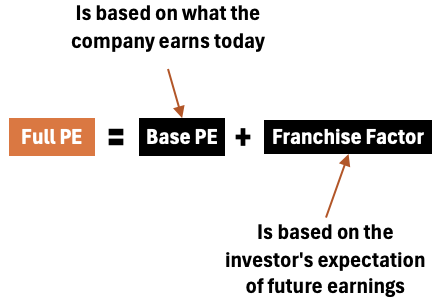
The gap between what a company earns today and what investors expect it can earn tomorrow is what makes the difference between a low P/E and a sustainable high P/E stock.
Understanding that gap requires splitting the P/E ratio into two parts.
- First comes the Base P/E, the segment justified purely by the sustainability of current earnings.
- Then comes an additional layer: the Franchise Factor, which captures the market’s expectations of the firm’s ability to reinvest capital at above-market rates of return. The term “franchise” simply suggests an advantage that the company can use again and again to earn above-normal returns.
This approach offers a structured way to decode growth expectations baked into a stock price .
Many investors rely on gut feel to judge when a P/E is “too high.” But once you start separating the P/E into its “underlying components”, those judgments become more concrete.
This way, we begin to actually see precisely how much growth the market must be pricing in, and whether that growth is realistic or not.
Why Breaking The P/E is Necessary?
A P/E ratio looks like a single number, but it actually blends two very different ideas: the value of current earnings and the value the market assigns to future reinvestment.
Most investors treat the P/E as a unified measure, which is why high multiples often seem mysterious or unjustified.
But when you decompose the P/E, it becomes to easy to see through why a company’s P/E is high or low.
So, all PE’s must bee seen with this perspective: by separating the portion supported by today’s steady earnings (the Base P/E) from the portion attributable to value-creating growth (the Franchise Factor).
This way, we can immediately see whether the market is rewarding the company for genuine economic advantage or simply for expanding revenue without adding shareholder value.
Growth Component
It is also importat to understand that high P/E multiples cannot be explained by growth alone.
The point is, growth matters, but not all growth is value-creating.
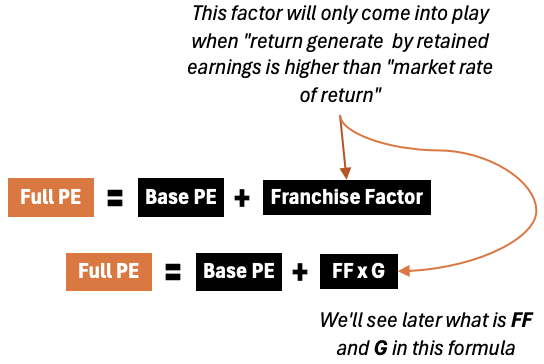
A company’s P/E rises above its base level only when the money it reinvests (its retained earnings), earns returns higher than what investors could get elsewhere.
A company growing 10% a year does not automatically deserve a higher PE multiple. If that growth merely earns the market rate of return, high P/E is not justified. Investors of a company growing at 10% a year, will gain nothing from the reinvested earnings. They could have reinvested that profit, received as dividends themselves, say in an index fund, to earn a better rate of return.
Market Rate of Return and Return on Retained Earnings
- Market rate of return: In Indian context it is the return an investor can reliably earn elsewhere in the market. For example, a good Nifty index funds can fetch 12% return. Hence, in India, we can use 12% as the benchmark when judging a company’s reinvestment performance.
- Return generated by the retained earnings: I call it return on new investment (RONI or R). It is not ROE, ROCE, or ROIC.
The P/E increases only when the business has “franchise opportunities.”
What is franchise opportunity? Franchise opportunities are projects where a company can deploy new capital and consistently earn, say, 18% when the market requires 12%. Example: a dominant brand launching stores that reliably deliver far above-market returns.
Once you start thinking about P/E this way, the metric becomes far more intuitive. It reflects not only what the business is today, but also the market’s belief that management can keep finding profitable places to deploy capital tomorrow.
1. Understanding the Base P/E
At its core, the Base P/E answers one question:
If the company never again found a single attractive new investment, what would its P/E be? Base P/E assumes the company’s current earnings (EPS) stay flat indefinitely with no value-creating new investments.
It’s natural to think Base P/E should simply be Price ÷ EPS assuming EPS stays constant forever.
But this is not a correct way of looking at the Base PE. Why? Because Price ÷ EPS formula already assumes that the price is correctly set. But price can also be too inflated or too low, right? So the base P/E cannot be calculated using this formula. This logic is exactly what the Base P/E concept is trying to avoid.
So, lets ask this fundamental quested again related to the Base P/E:
“If this company’s current earnings remains unchanged forever, at what multiple would the market value that earnings stream today?”
To answer that, we treat the earnings like a perpetual cash flow. The value of a perpetual cash flow is:
k = the return investors demand for a company with this risk level.
Therefore the P/E multiple implied by this perpetuity is:
So if the market requires a 12% return:
This does not come from the company’s price or its internal fundamentals. It comes from the market’s discount rate because, in a no-growth world, the only thing determining the multiple is how the market prices a perpetuity of flat earnings.
Put simply:
- If earnings never grow, the company’s fundamentals don’t make the P/E rise.
- The market’s required return sets the Base P/E.
That’s why stable, no-growth firms in the academic models all converge to this P/E.
2. Where Full P/E Comes From: Introducing the Franchise Factor
So when does a P/E rise above base level?
When the company has opportunities to reinvest capital at a rate R greater than the market return k.
This difference, (R – k), is the essence of the franchise.
To quantify the P/E uplift using a term called the Franchise Factor (FF):Franchise Factor=r⋅kR−k
Where:
- RONI (R) = return on new investments
- r = return on existing equity (current ROE)
- k = required market return
This factor measures how powerful each dollar of incremental investment is in lifting the company’s P/E.
A firm reinvesting at market rates (R = k) has a Franchise Factor of zero. There is no P/E expansion.
A firm reinvesting at rates far above the market has a positive FF, but even then, the multiplier is surprisingly modest. For example, a 15% ROE when the market requires 12% yields:
This means every extra rupee the company can productively reinvest adds only 1.67 points to its P/E. In other words, raising the P/E meaningfully is hard. Why? Because it requires finding huge amounts of new high-return investment opportunities, often several times larger than the company’s existing equity.
3. Measuring the Growth Component: The Growth Equivalent (G)
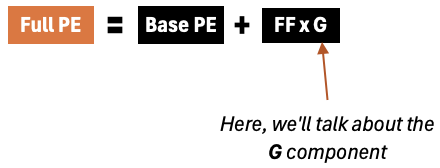
Growth Equivalent (G) = the present value (today) of all future amounts the company will reinvest, expressed as a percentage of current book equity.
Let’s see how to calculate “G” for a stock.
Finite Period = 10 Years
- Current book value of equity (Book₀) = Rs. 100 crore
- Planned reinvestment rate (g) = 10% of beginning-of-year book each year (i.e., company reinvests 10% of book into new projects annually)
- Market discount rate (k) = 12%
- Period of growth to examine = 10 years
Step 1 — Compute the annual reinvestment amounts (years 1..N).
Each year t the company reinvests:
and book evolves as
With Book₀ = 100 and g = 10%:
- Year-1 investment = 100 × 0.10 = 10.00 crore
- Year-2 investment = 110 × 0.10 = 11.00 crore
- Year-3 investment = 121 × 0.10 = 12.10 crore
- Year-4 investment = 133 x 0.10 = 13.31 crore
- Year-5 investment = 146 x 0.10 = 14.64 crore
- Year-6 investment = 161 x 0.10 = 16.10 crore
- Year-7 investment = 177 x 0.10 = 17.71 crore
- Year-8 investment = 194 x 0.10 = 19.48 crore
- Year-9 investment = 214 x 0.10 = 21.43 crore
- Year-10 investment = 235 x 0.10 = 23.58 crore
Step 2 — Discount each year’s investment to present value (PV).
Discount factor for year t = 1 / (1 + k)^t. Example with k = 12%:
| Year | Cash Flow | PV Factor @12% | Present Value (PV) |
| 1 | 10 | 0.8929 | 8.93 |
| 2 | 11 | 0.7972 | 8.77 |
| 3 | 12.1 | 0.7118 | 8.61 |
| 4 | 13.31 | 0.6355 | 8.46 |
| 5 | 14.64 | 0.5674 | 8.3 |
| 6 | 16.1 | 0.5066 | 8.16 |
| 7 | 17.71 | 0.4523 | 8.01 |
| 8 | 19.48 | 0.4039 | 7.87 |
| 9 | 21.43 | 0.3606 | 7.73 |
| 10 | 23.58 | 0.322 | 7.59 |
| Total all PVs | Rs. 82.44 |
Step 3 — Sum the discounted investments to get total PV of future reinvestment.
For the 10-year example the total PV of those reinvestments ≈ Rs. 82.44 crore.
Step 4 — Express that PV as a percentage of current book to get G.
A “G” of 82.44% means the present value of all future reinvestments (over the next 10 years under the stated assumptions) is worth 82.44% of today’s book equity.
Perpetual Growth (Forever):
If the company can sustain reinvestment forever at rate g (but k > g), the Growth Equivalent simplifies to the familiar formula:
With g = 10% and k = 12%:
What this 500% number means?
To justify perpetual 10% reinvestment at above-market returns, the company would need reinvestment opportunities whose present value equals 5× current book. The 5x multiple highlights that growing even at 10% perpetually is a very large requirement (almost like an impossibility).
This is and a reason why extremely high P/Es are so rare.
How to implement with real company reports:
- Balamce Sheet > Take Book value (Book₀).
- From management comment/capex policy/retention, choose a realistic g (or compute actual historical reinvestment = ΔBook + dividends ± buybacks).
- Discount Rate: Choose a discount rate k appropriate to company risk. Like, in our examples, I’ve assumed it as 12% because even an index fund can give me that much return in India.
- Build a 1..N year schedule of investments = Book₀×(1+g)^{t-1}×g, discount each to PV at k, sum to get PV, divide by Book₀ to get G.
- Use G in the Full P/E formula: Full P/E = Base P/E + (FF × G).
If you want, I can convert this into a tiny Excel/Google Sheets template (with the formulas filled in) so you can plug in real company numbers and get G immediately.
4. Putting It Together: Calculating the Full P/E
The complete P/E is:
Where:
- Base P/E reflects the perpetuity value of current earnings
- FF × G reflects the value of the company’s future reinvestment opportunities
Example: A Firm with 10% Growth and 15% ROE
Given:
- Base PE = 8.33 – see step #1)
- FF = 1.67 (see step #2)
- G = 500% (see step #3)
Then:
A company with a 15% ROE and 10% sustainable growth produced a P/E of 16.67 .
The broader point is that even great businesses need extraordinary reinvestment capacity to justify P/Es above 20.
And those reinvestment opportunities must persist, not just appear once. The moment a company stops finding new high-return projects, its P/E begins drifting back toward the Base P/E.
Full P/E Table For a Combinations of r, R, g
| k (investor's Required return) | Base P/E | r (current ROE) | R (RONI) | g (reinvestment rate) | FF [(R – k) / (r·k)] | G [g / (k – g)] | Full P/E [Base P/E + FF×G] |
|---|---|---|---|---|---|---|---|
| 0.12 | 8.33 | 0.15 | 0.14 | 0.05 | 1.11 | 0.71 | 9.13 |
| 0.12 | 8.33 | 0.15 | 0.14 | 0.07 | 1.11 | 1.40 | 9.89 |
| 0.12 | 8.33 | 0.15 | 0.14 | 0.09 | 1.11 | 3.00 | 11.67 |
| 0.12 | 8.33 | 0.15 | 0.14 | 0.10 | 1.11 | 5.00 | 13.89 |
| 0.12 | 8.33 | 0.15 | 0.16 | 0.05 | 2.22 | 0.71 | 9.92 |
| 0.12 | 8.33 | 0.15 | 0.16 | 0.07 | 2.22 | 1.40 | 11.44 |
| 0.12 | 8.33 | 0.15 | 0.16 | 0.09 | 2.22 | 3.00 | 15.00 |
| 0.12 | 8.33 | 0.15 | 0.16 | 0.10 | 2.22 | 5.00 | 19.44 |
| 0.12 | 8.33 | 0.15 | 0.18 | 0.05 | 3.33 | 0.71 | 10.71 |
| 0.12 | 8.33 | 0.15 | 0.18 | 0.07 | 3.33 | 1.40 | 13.00 |
| 0.12 | 8.33 | 0.15 | 0.18 | 0.09 | 3.33 | 3.00 | 18.33 |
| 0.12 | 8.33 | 0.15 | 0.18 | 0.10 | 3.33 | 5.00 | 25.00 |
| 0.12 | 8.33 | 0.15 | 0.20 | 0.05 | 4.44 | 0.71 | 11.51 |
| 0.12 | 8.33 | 0.15 | 0.20 | 0.07 | 4.44 | 1.40 | 14.56 |
| 0.12 | 8.33 | 0.15 | 0.20 | 0.09 | 4.44 | 3.00 | 21.67 |
| 0.12 | 8.33 | 0.15 | 0.20 | 0.10 | 4.44 | 5.00 | 30.56 |
| 0.12 | 8.33 | 0.18 | 0.14 | 0.05 | 0.93 | 0.71 | 8.99 |
| 0.12 | 8.33 | 0.18 | 0.14 | 0.07 | 0.93 | 1.40 | 9.63 |
| 0.12 | 8.33 | 0.18 | 0.14 | 0.09 | 0.93 | 3.00 | 11.11 |
| 0.12 | 8.33 | 0.18 | 0.14 | 0.10 | 0.93 | 5.00 | 12.96 |
| 0.12 | 8.33 | 0.18 | 0.16 | 0.05 | 1.85 | 0.71 | 9.66 |
| 0.12 | 8.33 | 0.18 | 0.16 | 0.07 | 1.85 | 1.40 | 10.93 |
| 0.12 | 8.33 | 0.18 | 0.16 | 0.09 | 1.85 | 3.00 | 13.89 |
| 0.12 | 8.33 | 0.18 | 0.16 | 0.10 | 1.85 | 5.00 | 17.59 |
| 0.12 | 8.33 | 0.18 | 0.18 | 0.05 | 2.78 | 0.71 | 10.32 |
| 0.12 | 8.33 | 0.18 | 0.18 | 0.07 | 2.78 | 1.40 | 12.22 |
| 0.12 | 8.33 | 0.18 | 0.18 | 0.09 | 2.78 | 3.00 | 16.67 |
| 0.12 | 8.33 | 0.18 | 0.18 | 0.10 | 2.78 | 5.00 | 22.22 |
| 0.12 | 8.33 | 0.18 | 0.20 | 0.05 | 3.70 | 0.71 | 10.98 |
| 0.12 | 8.33 | 0.18 | 0.20 | 0.07 | 3.70 | 1.40 | 13.52 |
| 0.12 | 8.33 | 0.18 | 0.20 | 0.09 | 3.70 | 3.00 | 19.44 |
| 0.12 | 8.33 | 0.18 | 0.20 | 0.10 | 3.70 | 5.00 | 26.85 |
| 0.12 | 8.33 | 0.20 | 0.14 | 0.05 | 0.83 | 0.71 | 8.93 |
| 0.12 | 8.33 | 0.20 | 0.14 | 0.07 | 0.83 | 1.40 | 9.50 |
| 0.12 | 8.33 | 0.20 | 0.14 | 0.09 | 0.83 | 3.00 | 10.83 |
| 0.12 | 8.33 | 0.20 | 0.14 | 0.10 | 0.83 | 5.00 | 12.50 |
| 0.12 | 8.33 | 0.20 | 0.16 | 0.05 | 1.67 | 0.71 | 9.52 |
| 0.12 | 8.33 | 0.20 | 0.16 | 0.07 | 1.67 | 1.40 | 10.67 |
| 0.12 | 8.33 | 0.20 | 0.16 | 0.09 | 1.67 | 3.00 | 13.33 |
| 0.12 | 8.33 | 0.20 | 0.16 | 0.10 | 1.67 | 5.00 | 16.67 |
| 0.12 | 8.33 | 0.20 | 0.18 | 0.05 | 2.50 | 0.71 | 10.12 |
| 0.12 | 8.33 | 0.20 | 0.18 | 0.07 | 2.50 | 1.40 | 11.83 |
| 0.12 | 8.33 | 0.20 | 0.18 | 0.09 | 2.50 | 3.00 | 15.83 |
| 0.12 | 8.33 | 0.20 | 0.18 | 0.10 | 2.50 | 5.00 | 20.83 |
| 0.12 | 8.33 | 0.20 | 0.20 | 0.05 | 3.33 | 0.71 | 10.71 |
| 0.12 | 8.33 | 0.20 | 0.20 | 0.07 | 3.33 | 1.40 | 13.00 |
| 0.12 | 8.33 | 0.20 | 0.20 | 0.09 | 3.33 | 3.00 | 18.33 |
| 0.12 | 8.33 | 0.20 | 0.20 | 0.10 | 3.33 | 5.00 | 25.00 |
Conclusion
The idea behind the Full P/E is straightforward, a company’s P/E is not just about how much it earns today, but also about how well it can use its profits to create more value in the future.
The Base P/E tells you what the company is worth if earnings simply continue as they are. The extra P/E (Franchise factor), what lifts a stock above this base, comes only when the company can reinvest money at returns higher than what investors can get elsewhere.
This means high P/Es are not automatic, even for fast-growing firms. A company must prove that its future investments can genuinely produce superior returns.
When you break the P/E into these parts, you can clearly see whether a high valuation is supported by strong reinvestment opportunities or whether the market is hoping for more than the business can realistically deliver.
Have a happy investing.