
Earning Yield Formula: How to calculate earnings yield? How To Interpret It?

Introduction
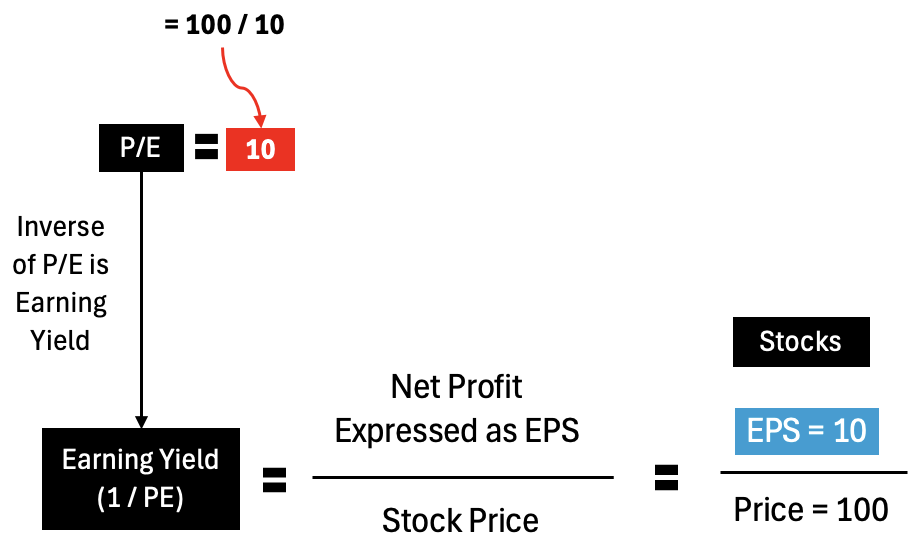
We all use the P/E ratio to judge the valuation of stocks, right? Earning yield is nothing but the inverse of the P/E ratio. In terms of a formula, the earnings yield is calculated as Earnings Per Share (EPS) divided by the Stock Price. But in this blog post, I’ll share with you a new way of looking at the earnings yield, not just as an inverse of the P/E ratio.
Let’s start with the very basic. If a stock price is Rs. 100 and its EPS is Rs. 10/share, its P/E ratio will be 10x.
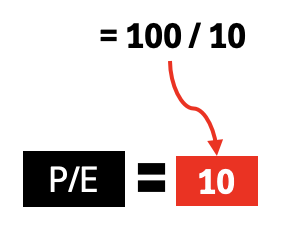
The inverse of P/E is earnings yield, so 1/10 = 10%. So, in terms of formula, earnings yield will be the EPS divided by the stock price.
How to look at a stock’s Earnings Yield?
To understand the application of the Earnings Yield in stock valuation, we’ll include the bank’s fixed deposit in our discussion.
Suppose you have Rs. 100 available for investing. You have two options in your mind: the first is a fixed deposit with an interest yield of 7% and the other is a stock whose earnings yield is 10%.
A fixed with an interest yield of 7% means you will earn Rs. 7 per year on every invested Rs. 100.
In stock investing, an earning yield of 10% means that for every Rs. 100 of invested money, the company is generating a total net profit Rs. 10.

Note, A company need not distribute all of its net profit (PAT) to its shareholders. It means, out of the total net profit of Rs. 10 per share, the company may distribute only Rs. 1 as a dividend. So, the cash in hand for the shareholder will Rs. 1 per share (which is a dividend yield of 1%).
So you can see the difference between a fixed deposit and a stock
| SL | Description | Fixed Deposit | Stock |
| 1 | Investment | Rs, 100 | Rs, 100 |
| 2 | Cash Return (Dividend/Interest) | Rs. 7 (risk free) | Rs. 1 (variable) |
| 3 | Retained Earning (reinvestment) | Rs. 0 | Rs. 9 (variable) |
| 4 | Earning Yield (Interest Yield) | 7% | 10% (variable) |
| 5 | Potential For Future Growth of Return | Zero | Yes (as Rs. 9 gets reinvested back in the company) |
What can we interpret from the above table?
Though a fixed deposit has a lower yield of 7% than the stock’s earnings yield of 10%, but some investors will still prefer a fixed deposit. Why? Because the return of a fixed deposit of Rs. 7 is assured (risk-free), but the earning yield of stock can vary (there is a risk of loss).
So, an investor would weigh the low but risk-free return of a fixed deposit versus the high but variable return of stocks.
In this case, some investors may think that the potential to earn a 3% higher return (risk premium) as compared to the assured return of the fixed deposit is not worth it.
At the risk premium gap increase (say from 3% to say 5%), the allure to take the risk increases.
How will the risk premium increase? It will increase when the P/E ratio falls. It means we must buy stocks at a lower P/E multiple.
Earning Yield is not Dividend Yield, still, why is it useful data for investors?
Can the present earnings yield give us an idea of potential future return? How?
To understand it, we must recall our earlier discussion. What is Earnings Per Share (EPS)? It is basically a company’s net profit (PAT) expressed on per per-share basis. For example, if a company makes Rs. 1,000 crore as net profit (PAT) and its number of shares outstanding is 100 crore, then its EPS will be PAT/shares = 1000/100 = 10/share.
A stock may show an Earnings Yield of 10%, but it is not the same as the dividend yield of 10%. Why? Because not all of the company’s profits (PAT) is paid to the shareholders as dividends.
Suppose there is a company whose EPS is Rs. 10 per share. It pays Rs. 1 per share as dividends, and retains and reinvests Rs. 9 per share. This company is also capable of increasing its EPS at a rate of 10% per annum. This arrangement can be shown as below:
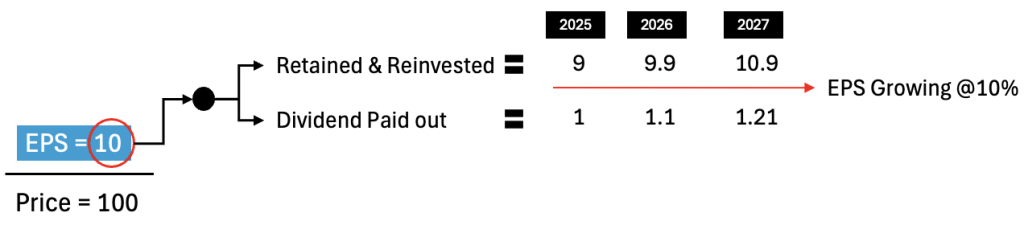
By the year 2026, the company’s EPS will become Rs. 11/share, and its retained earnings will be Rs. 9.9 and the dividend per share will be Rs. 1.1 per share. Similarly, in 2027, EPS will be Rs. 12.1 per share, of which Rs. 10.9 will be retained, and Rs. 1.21 will be paid out as dividends.
Assuming that the company’s PE remains at 10x levels after two years (in 2017) the stock price of the company will be at Rs. 121 per share (EPS x PE = 10 x 12.1). This means, in two years, the stock price grew from Rs. 100 to Rs. 121. This is a growth rate of 10% per annum.
Similarly, if there is a PE expansion from 10x to 11x and 12x, the return expansion will also take place from 10% to 15% to 20% per annum, respectively.
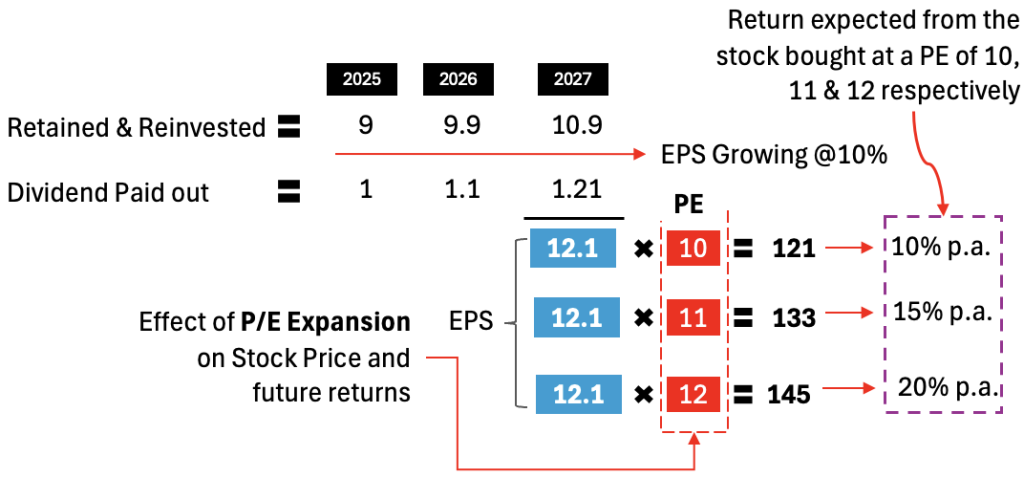
What I’ve shown above is nothing new. I just want you to visualize how EPS growth and P/E expansion can lead to faster returns over time.
Two Key Risks Associated with Stock Investing
At the beginning of this post, we discussed that though a fixed deposit has a lower yield of 7% than the stock’s earnings yield of 10%, but some investors will still prefer a fixed deposit. The reason for the pick is the perception of risk-reward balance.
The question is, for a 3% potential extra gain, is it worth taking a risk of investing in the stock?
But we must also ask a second important question. What is the risk of investing in the stock? Instead of a theoretical answer, let me give you a visual reply that will help you recall this information when required.
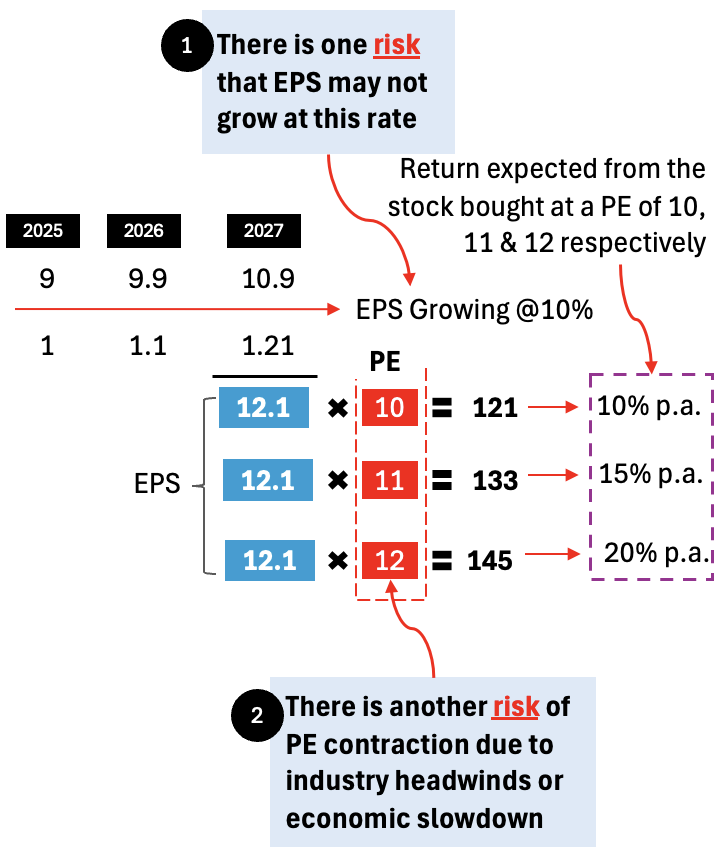
There are two risks associated with stock that is absent when we are dealing with risk-free investment options like Bank FDs, bonds, or debt funds.
- Related to EPS Growth: We have assumed an EPS growth rate of 10% per annum in a stock. But it is not necessary that the business fundamentals (revenue growth or margin expansion) must only grow. Due to several reasons like competitive forces, demand slump, and cost inflation, it may lead to profit contraction instead of growth. In this case, our assumed retained earnings and reinvestment expansion will not take place from Rs. 9 to 9.9, to 10.9 per share. It may also lead to dividend contraction, or it may also cease to exist.
- Related to PE: Another risk can happen on a more macro level. Suppose there emerges a political situation in which the government at the center may fall in the coming election. This may lead to policy discontinuity, etc. Such a situation of uncertainty often leads to PE contraction in industries. Other more common factors that can lead to PE rerating of industries are oil price escalation, Rupee depreciation, slow GDP growth, rising interest rates, possibilities of war, etc. In this case, our assumed PE expansion from 10x to 11x to 12x may not take place.
Conclusion
In terms of formula, it is very easy to remember earnings yield, which is the inverse of the P/E ratio. So, the earnings yield is nothing but EPS divided by stock price (or net profit divided by the market capitalization).
Suppose there is a situation where you want to invest Rs. 100. You have two options for investing, in a bank’s FD or in a stock. The interest yield of the FD is 7% and the earnings yield of the stock is 10%. What will be your choice?
Investing by looking only at the earnings yield (10% being higher than 7%) will be a mistake. What will be prudent at this stage will be to establish a risk-return balance.
Return from a bank’s fixed deposit is assured. You will get your 7% promised yield no matter what. But in the case of stock, there is a risk of EPS stagnation or PE contraction in the times to come.
In such situations, it becomes very important for the investor to build a realistic thesis (a story) before picking a stock. If your thesis says that there may be a short-term volatility in EPS or some PE contraction, but in the long term, both will grow, it builds an ideal investment ground.
So, next time, when you look at a company’s P/E ratio, try to analyze it using the Earnings Yield concept as explained here.
Have a happy investing.
Please note: In my next blog post, I’ll present to you a concept of Franchise P/E. In the earning yield concept, we assumed a P/E and then went on to derive a potential return from this stock. In the Franchise P/E concept, we will assume a rate of return, and from there, we will calculate if the stock’s PE is currently valued to generate our assumed return.
Please wait for my next article. You can also subscribe to my newsletters and get notifications of a new post right into your inbox.
Download: You can download the full Earnings Yield infographics from here.
