Introduction
Most investors approach the balance sheet as a formality. For them, it is something to glance at after they are convinced by profits and growth. Sounds fair, right? But let me tell you, seasoned professionals do the reverse.
They begin with the balance sheet because it exposes the financial truth of the business, stripped of narratives and short-term performance.
So it will not be an overstatement to say that the balance sheet is a more reliable financial report than P&L, especially for long-term investing.
Long before the profit would disappoint or valuations get compressed, the balance sheet quietly reveals where fragility lies in the company. The report can tell whether the company can handle delayed collections, rising costs, or a temporary drop in cash flows without putting stress on its finances.
A balance sheet is not about performance. It is about the financial structure of the business.
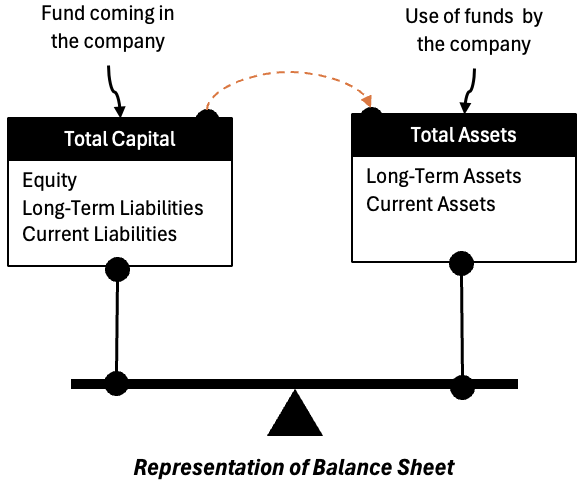
Once you understand this simple structure, the balance sheet starts answering far more practical questions.
It tells you the following:
- How a business is funded: This shows whether the company relies mainly on its own profits, external debt, or frequent capital raising to operate and grow.
- Where the risks sit: The balance sheet highlights which parts of the business are financially sensitive, such as high borrowings, stretched working capital, or large, illiquid assets.
- How resilient it is in a bad year: By looking at liquidity and obligations, you can judge whether the company can continue operating comfortably when cash inflows slow down.
- Whether growth is coming from strength or strain: The balance sheet reveals if expansion is being funded by internally generated cash or by piling on excess debt (which is becoming a burden).
Once you learn to read the balance sheet properly, many “good-looking” companies start looking uncomfortable.
So let’s see how a non-finance guy can learn to read the balance sheet like a professional.
Table of Contents
- Introduction
- How a Professional Actually Approaches a Balance Sheet
- Step 1: Identify the Business Model From the Balance Sheet Alone
- Step 2: Liquidity Check — Can the Company Survive a Bad Year?
- Step 3: Capital Structure — Who Really Owns the Business?
- Step 4: Asset Quality — Are These Assets Real and Productive?
- Step 5: Balance Sheet Over Time — Why One-Year Numbers can Mislead
- Step 6: How to Read the Balance Sheet of an NBFC — Bajaj Finance
- Conclusion
How a Professional Actually Approaches a Balance Sheet
A professional does not read a balance sheet line by line. Neither do they keep a checklist of 30 ratios running in the head.
They do something very different than most of us. The analysts try to form a mental picture of the business using the balance sheet as raw material.
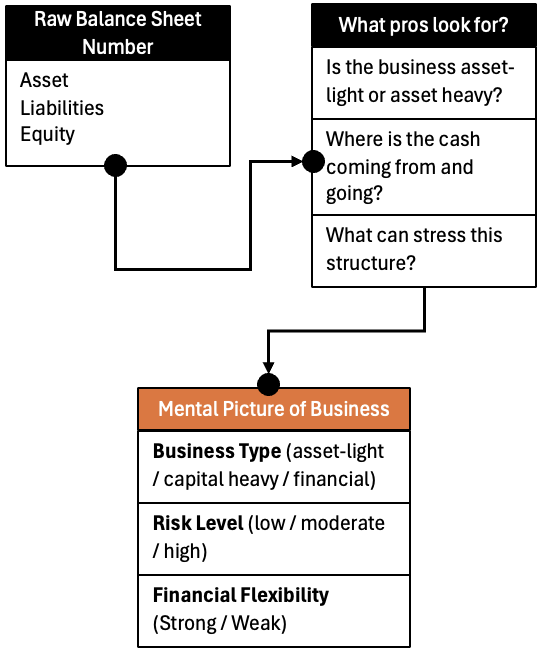
The core questions are always the same:
- How is this business financed?
- Where is the financial stress likely to appear?
- Does growth make the balance sheet stronger or weaker?
Let’s learn to do this step by step. For better clarity of the concept, I’ll be using the balance sheet of three very different Indian companies:
- Pidilite Industries – it is an asset-light business.
- Larsen & Toubro – it is an asset-heavy, project-based business.
- Bajaj Finance – it is a financial company where the balance sheet is the business.
Step 1: Identify the Business Model From the Balance Sheet Alone
Before examining profits, focus solely on what appears on the asset side of the balance sheet. Why?
Because assets reveal the economic nature of the business: (a) what the company actually owns, (b) how capital is deployed, and (c) which parts of the business are tied up in factories, inventory, receivables, or financial assets.
1.1 Pidilite Industries: What Kind of Business Is This?
Let us start with a very basic exercise. Forget what Pidilite does, forget the brand, and forget the profit numbers for a moment. Look only at the asset side of the balance sheet and ask one simple question:
Where is the company’s money actually sitting?
As of Mar-25, Pidilite’s total assets are about Rs. 14,011 crore.
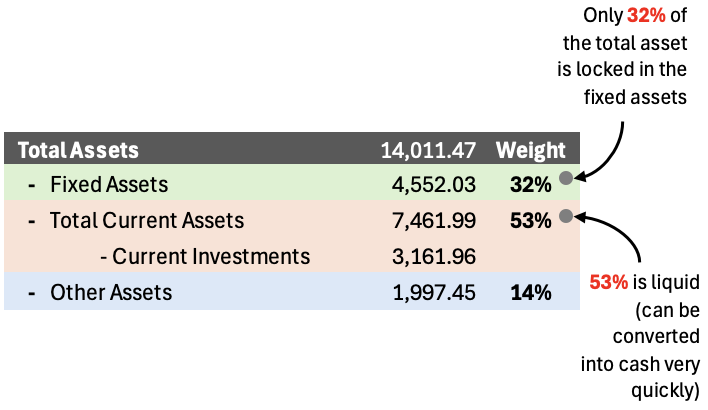
Let us decode Pidilite’s asset side into simple buckets and see where the money actually sits:
- Fixed assets are roughly Rs. 4,552 crore, which includes factories, plants, and equipment
- Current assets are Rs. 7,462 crore, which consists of inventory, receivables, cash, and investments
- Out of these current assets, current investments alone are Rs. 3,162 crore
This breakdown is revealing; it says a lot about the business.
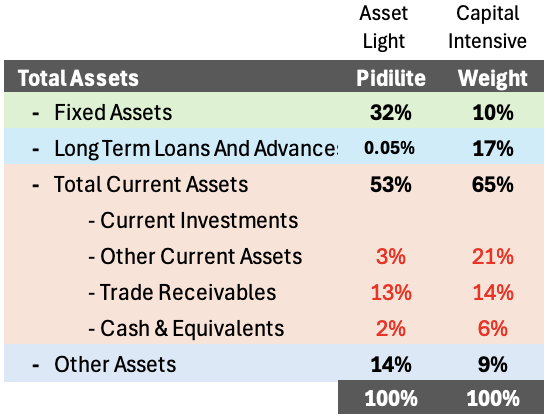
- Less than one-third of the company’s assets are tied up in factories and physical infrastructure.
- A significant portion of the balance sheet is either liquid or can be converted into cash in a relatively short period of time.
What can be concluded from this pattern?
It tells us that Pidilite does not need to keep pouring large amounts of capital into fixed assets just to keep the business running or growing. That is why this balance sheet does not belong to a capital-hungry business. It belongs to a company where capital circulates efficiently. The excess cash also has room to accumulate rather than being constantly reinvested just to sustain operations.
This is the first mental label a professional assigns after looking at the balance sheet: asset-light, financially flexible business.
Now compare that with L&T.
1.2 Larsen & Toubro: A Different Balance Sheet
Now, let’s repeat the same exercise for L&T.
Again, forget the reputation of the company, the order book headlines, or the profit numbers. Look only at the asset side and ask:
Where is the money actually deployed?
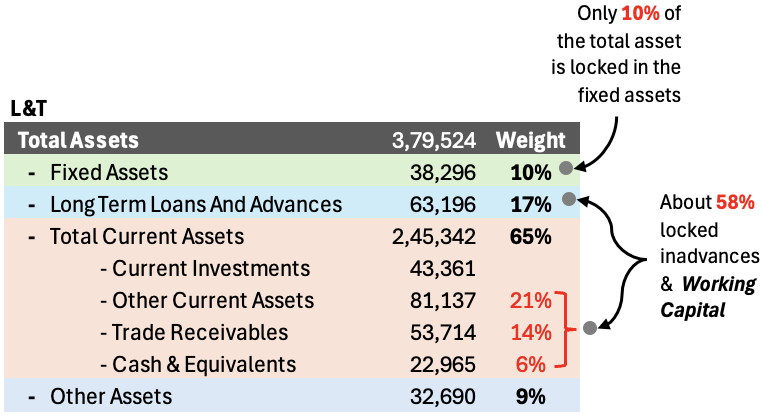
As of Mar-25, L&T’s total assets are roughly Rs. 3.8 lakh crore, which immediately puts it in a very different league from Pidilite in terms of scale.
But scale alone is not the point. The composition of these assets matters far more.
At first glance, fixed assets stand at about Rs. 38,296 crore, which is only around 10% of total assets. This is where many readers get confused. If fixed assets are such a small part, why is L&T considered a capital-intensive business?
The answer lies in where the rest of the money is stuck.
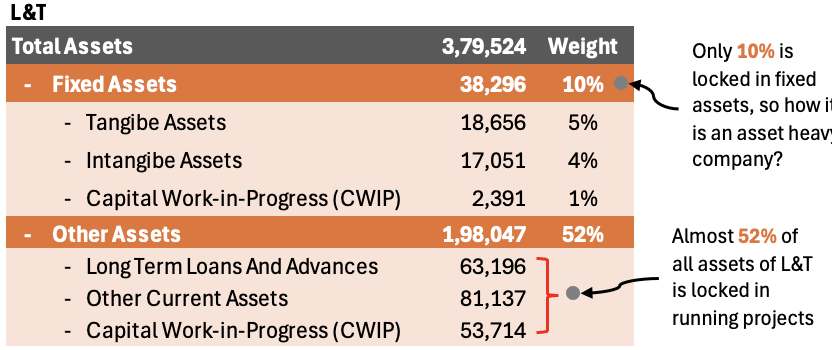
A large portion of L&T’s balance sheet is tied up in items such as:
- Long-term loans and advances of Rs. 63,196 crore, largely linked to projects and subsidiaries. This often includes funds advanced for land, equipment, or early project expenses that will be recovered gradually as the project progresses and bills are raised and paid.
- Trade receivables of Rs. 53,714 crore, reflecting money yet to be collected from clients
- Other current assets of Rs. 81,137 crore: This includes the following:
- Unbilled revenues: Work completed at project sites but not yet billed to the client
- Contract assets: It represent work that L&T has already completed on site, but the client has not yet formally approved that stage of the project, so the invoice cannot be raised yet. Think of it as work done, materials installed, and costs incurred—but the paperwork and approval needed to bill the client are still pending.
- Advance Recoverable: Money paid upfront for materials, subcontractors, or mobilisation that will be adjusted against future bills
These numbers tell a very clear story. L&T does not need massive factories to operate, but it does need large amounts of capital to fund projects upfront. This capital is required long before the cash comes back.
Money goes out early and comes back slowly. This is the nature of an engineering & construction based companies (like L&T).
Capital intensity, for companies like L&T, here does not come from machines and buildings; it comes from working capital locked inside projects. This is why professionals look beyond fixed assets when reading such balance sheets. The real risk is not how much steel or cement sits on the books, but how much cash is tied up waiting to be realized.
This is the mental label an analyst assigns after seeing this structure: project-driven business with high working capital and execution risk.
A professional already knows this: Pidilite’s risk is competitive; L&T’s risk is financial and execution-driven.
Step 2: Liquidity Check — Can the Company Survive a Bad Year?
After understanding the structure of the business, the next question a professional asks is very basic:
Can this company get through a difficult year without financial stress?
This has nothing to do with growth or margins. It is purely about day-to-day financial comfort.
Liquidity simply means the company’s ability to meet its short-term obligations using its short-term assets.
In other words, if cash inflows slow down for a while, does the company have enough readily available resources to keep operating normally?
2.1 Let us look at Pidilite.
As of Mar-25:
- Current assets (CA) are Rs. 7,462 crore
- Current liabilities (CL) are Rs. 3,290 crore
- CA / CL = 2.27x
Even before doing any calculations, this gap is telling. Pidilite has more than twice (2.27x) the short-term assets compared to what it needs to pay in the near term. This creates a natural buffer for the company.
Another way to look at this comfort is through working capital.
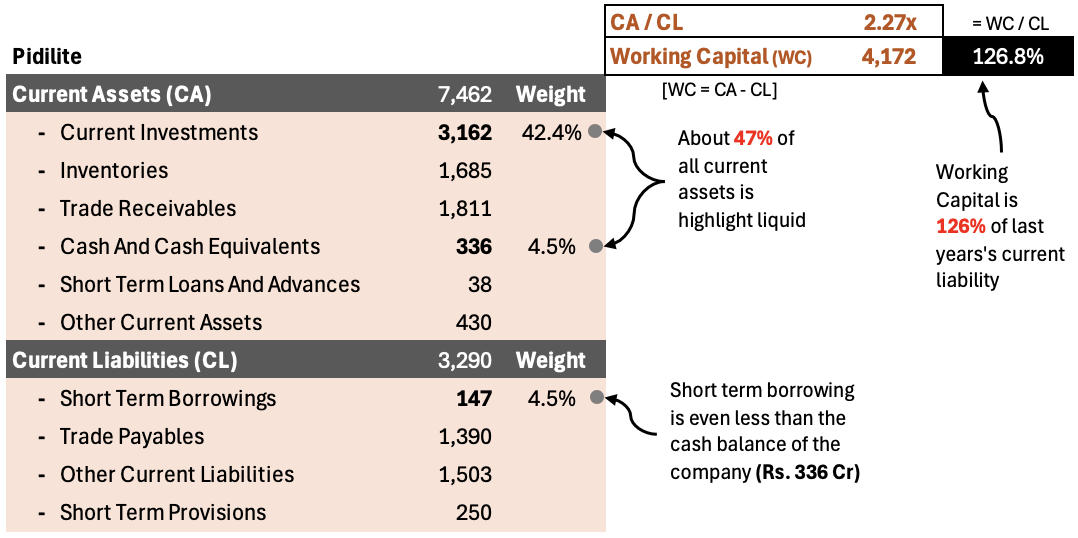
Working capital is simply the difference between current assets and current liabilities. In Pidilite’s case, this difference is clearly positive and comfortable, with current assets being 2.27 times current liabilities.
More importantly, the working capital is not locked up in slow-moving inventory or difficult-to-collect receivables; a large part of it sits in cash and liquid investments. This tells us that Pidilite’s working capital is not only sufficient but also high-quality. This gives it flexibility in managing operations.
Now look at the quality of these current assets.
- Cash and current investments together exceed Rs. 3,400 crore. It means a meaningful portion of the balance sheet is already in liquid form.
- At the same time, short-term borrowings are just Rs. 147 crore, which is almost negligible relative to the size of the business.
How to understand this mix of assets and liabilities?
Even if customers delay payments or the costs go up, Pidilite does not need to immediately approach banks or raise emergency funding. The balance sheet is strong enough to absorb the pressure by itself.
This is what financial comfort looks like.
This is one of the earliest signs professional analysts look for when assessing the risk of investing in a company.
2.2 L&T’s Liquidity Position: Looks Comfortable, Behaves Differently
Now apply the same liquidity lens to Larsen & Toubro.
As of Mar-25, L&T reports:
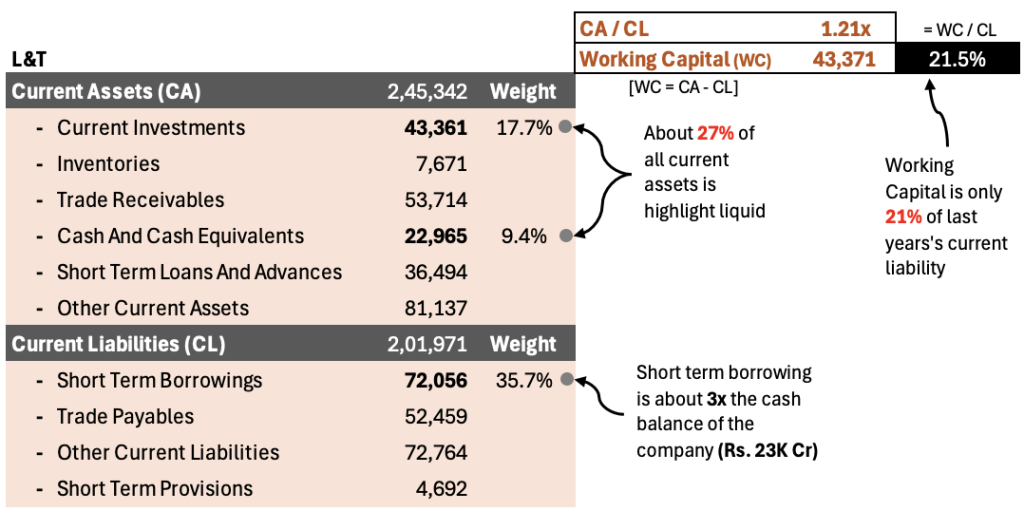
- Current assets (CA) of ₹2.45 lakh crore
- Current liabilities (CL) of ₹2.02 lakh crore
- CA / CL = 1.21x
At first glance, this suggests that L&T should be able to meet its short-term obligations. Current assets are higher than current liabilities, which means working capital is positive.
But let’s analyze the quantum of this working capital. In the case of Pidilite, the working capital to current liability ratio (WC/CL) was high at 126%, we can say that the working capital was as high as the last year’s current liability.
But in the case of L&T, the working capital to current liability ratio (WC/CL) is only 22% of the last year’s current liability. This level of liquidity cushioning is not very comfortable.
But this is also true that the nature of L&T’s business is such that even such levels of working capital is considered good.
In this post, my role is not to judge a company but to highlight how to perform its liquidity checks by looking at the balance sheet. But to make the judgment, it is important to understand the context. Comparing Pidility and L&T would not be correct.
To get a better perspective, we must compare the liquidity CA, CL, and Working Capital of companies operating in similar industries.
The right conclusion is not to label one balance sheet as “good” and the other as “bad.” Instead, understand the nature of liquidity. Pidilite’s liquidity comes mainly from its own cash and investments. L&T’s liquidity depends on how smoothly projects are executed and how quickly money is collected from clients.
Understanding this difference is exactly what a liquidity check is meant to reveal.
Step 3: Capital Structure — Who Really Owns the Business?
After liquidity, the next question a professional asks is about control and dependence. Capital structure tells us this about the company:
Who funds the business and, by extension, who has the real claim on its cash flows.
3.1 Pidilite: Equity-Funded Growth
Pidilite’s balance sheet makes this picture very clear. As of Mar-25:
- Shareholders’ funds stand at Rs. 9,754 crore
- Total borrowings, both long-term and short-term, are negligible
The simplest way to understand Pidilite’s capital structure is to see who has actually funded the business over time.
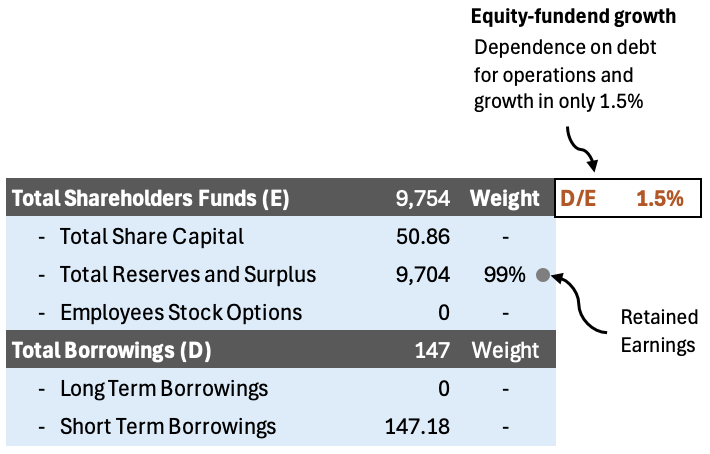
This means the business is largely funded by the money put in by shareholders and the profits the company has retained over the years.
There is no meaningful reliance on lenders to keep operations running or to fund growth.
When Pidilite earns profits, that money stays within the business and strengthens the balance sheet further. Growth does not require frequent borrowing or refinancing.
This kind of structure gives management flexibility and reduces financial risk, especially during periods when business conditions are not ideal.
This is what professionals mean by equity-funded growth – a business that grows primarily on its own cash generation rather than on borrowed money.
3.2 L&T: Debt as a Tool, Not a Choice
Now, let us look at Larsen & Toubro’s capital structure. This is where the contrast with Pidilite becomes very clear.
As of Mar-25, L&T’s balance sheet shows:
- Shareholders’ funds of Rs. 97,656 crore
- Total borrowings of Rs. 1,29,559 crore, split between
- Long-term borrowings of Rs. 57,503 crore
- Short-term borrowings of Rs. 72,056 crore
At a glance, this looks like a heavily leveraged balance sheet. The debt-to-equity ratio of about 132% tells us that borrowings are actually larger than the shareholders’ capital, funding the business.
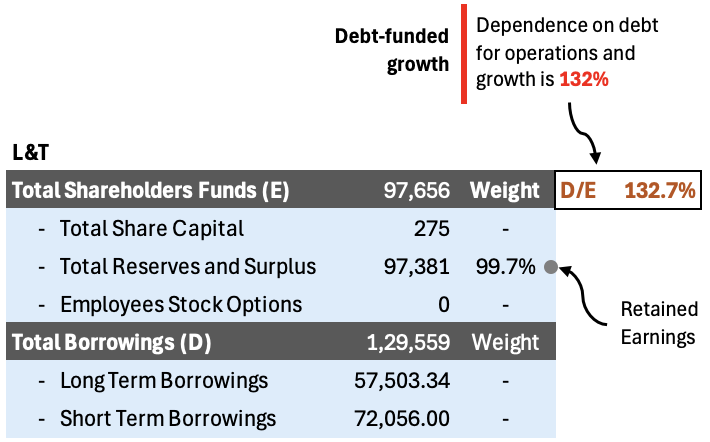
This immediately leads to an important interpretation. Unlike Pidilite, where growth is funded mainly through retained profits, L&T’s operations and expansion depend meaningfully on borrowed money.
Debt here is not taken occasionally to smooth out cash flows; it is a structural part of how the business operates.
To understand why, you need to think about the nature of L&T’s business. Large engineering and construction projects require heavy upfront spending on materials, subcontractors, equipment mobilisation, and execution costs. Cash goes out long before it comes back. Debt acts as a bridge between spending today and collections that happen much later.
This is why professionals do not ask, “Why does L&T have so much debt?” The more relevant question is: Is this debt supported by predictable project cash flows, and is it being managed sensibly over time?
That is where the second understanding becomes important (see the trend chart).
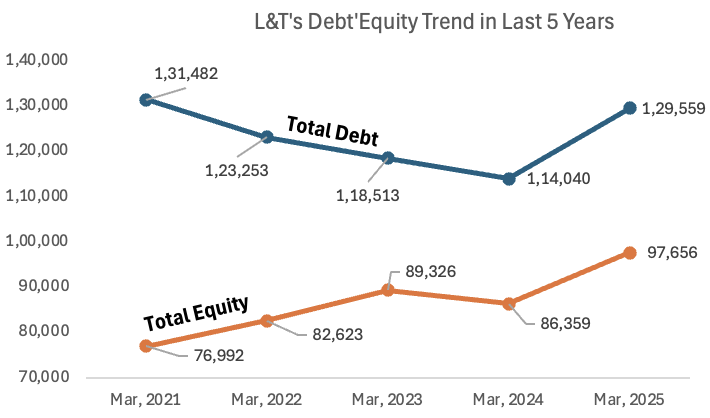
Looking at the five-year trend, two things stand out:
- Total debt has fluctuated but remained within a broad range, rather than rising uncontrollably
- Shareholders’ funds have steadily grown over time, reflecting retained earnings and capital discipline
This trend tells us that while L&T relies on debt, it has not allowed leverage to spiral out of control. Equity has grown alongside the business, providing a stabilising base under the borrowings.
In simple terms, L&T’s capital structure is debt-supported but not reckless. The balance sheet is designed to handle large, long-duration projects, but it also means the company is more sensitive to execution delays, cost overruns, and slow client payments than an asset-light business like Pidilite.
The professional takeaway is not that L&T’s balance sheet is weak. It is that ownership and risk are shared differently.
- Shareholders benefit from scale and execution.
- But lenders and suppliers (who supply on credit) also play a significant role in funding the business.
Understanding this relationship is very important to analyze an engineering company like L&T.
Step 4: Asset Quality — Are These Assets Real and Productive?
After understanding liquidity and capital structure, professionals move to a more uncomfortable question:
What exactly are these assets, and how reliably do they turn into cash and returns?
Not all assets shown on a balance sheet are equally useful. Some assets generate cash every day. Others sit on the books for years, doing almost nothing.
The job of the analyst is to separate economic assets from pure accounting assets.
Let us do this using the actual balance sheet numbers of our example companies.
4.1 Pidilite Industries — Assets That Are Already Working
Start with Pidilite’s Mar-25 balance sheet.
Fixed and Intangible Assets
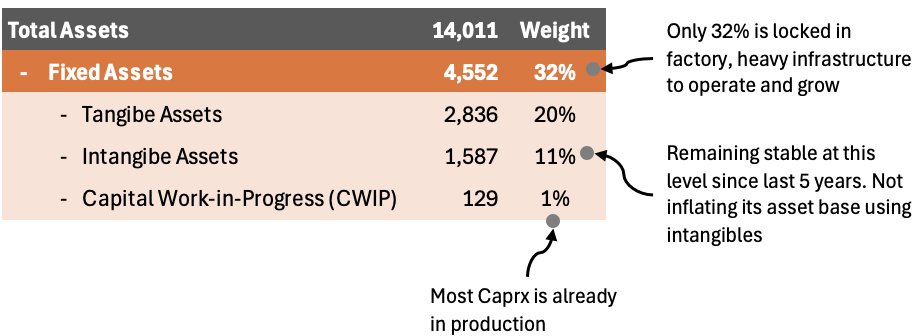
- Tangible assets: Rs. 2,836 crore
- Intangible assets: Rs. 1,587 crore
- Total fixed assets: Rs. 4,552 crore
Against total assets of Rs. 14,011 crore, fixed assets account for roughly 32% of the balance sheet. This tells us that Pidilite does not need to lock most of its capital into factories or heavy infrastructure to run and grow the business. A large part of the company’s asset base remains flexible, allowing capital to move quickly rather than being permanently tied down.
| Pidilite | Mar, 2021 | Mar, 2022 | Mar, 2023 | Mar, 2024 | Mar, 2025 |
| Intangibe Assets | 1,691.13 | 1,658.64 | 1,623.54 | 1,614.45 | 1,586.95 |
In the fixed asset base of 32%, tangible assets account for 20%, intangible accounts for 11%, and Capital work-in progress is only 1%.
Intangible assets are about Rs. 1,587 crore and have remained broadly stable over the last five years. This matters because it shows that Pidilite is not inflating its asset base by capitalising vague or aggressive intangibles such as brand values, goodwill from frequent acquisitions, or deferred expenses. In practical terms, the company’s reported assets are backed largely by tangible operations and cash-generating activity, rather than accounting estimates that depend heavily on assumptions.
Now look at Capital Work-in-Progress (CWIP): Rs. 129 crore
This is extremely small relative to the size of the business. It tells us that most capital expenditure is already completed and productive. Money is not stuck in half-finished factories or long-gestation projects.
Current Assets That Convert Smoothly
Now move to the current asset side:
- Current assets: Rs. 7,462 crore
- Current investments: Rs. 3,162 crore
- Cash: Rs. 336 crore
- Trade receivables: Rs. 1,811 crore
- Inventories: Rs. 1,685 crore
More than Rs. 3,400 crore sits in cash and liquid investments. This is money that is either already cash or can become cash quickly.
Receivables and inventory are reasonable for a consumer products company of this scale and do not dominate the balance sheet.
The Funding Context

Importantly, these assets are funded almost entirely by shareholders’ funds of Rs. 9,754 crore, with negligible debt.
That means assets are not under pressure to “perform immediately” to service borrowings.
In Pidilite’s case, these are high-quality economic assets. They are already productive, convert into cash smoothly, and are funded by equity rather than debt. Even before looking at ROE, an analyst can sense that asset productivity will be high and stable.
4.2 Larsen & Toubro — Assets That Depend on Execution
Now look at L&T’s Mar-25 balance sheet with the same discipline.
Fixed Assets Are Not the Whole Story
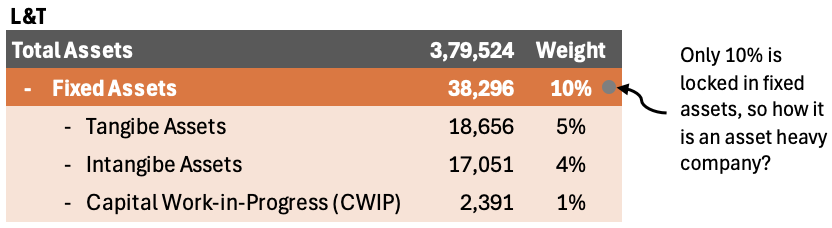
- Total assets: Rs. 3,79,524 crore
- Tangible assets: Rs. 18,656 crore
- Intangible assets: Rs. 17,051 crore
- Total fixed assets: Rs. 38,296 crore
Fixed assets are only about 10% of total assets. This is where many readers get confused. If fixed assets are small, why is L&T considered asset-heavy?
Because the real assets are sitting elsewhere.
Capital Locked in Projects
Look at these line items:
- Long-term loans and advances: Rs. 63,196 crore
- Other current assets: Rs. 81,137 crore
- Trade receivables: Rs. 53,714 crore
Together, these three heads alone are about Rs. 2 lakh crore.
What does this mean in practical terms?
- Long-term loans and advances represent funds deployed into project entities, subsidiaries, or long-duration contracts
- Other current assets include unbilled revenue and contract assets (work done but not yet approved or billed)
- Trade receivables represent money already billed but not yet collected
These assets are real, but they are not liquid. They become productive only when projects move forward smoothly, milestones are certified, and payments are received.
Funding Pressure Changes Asset Quality
Now, let’s see the funding structure of L&T:
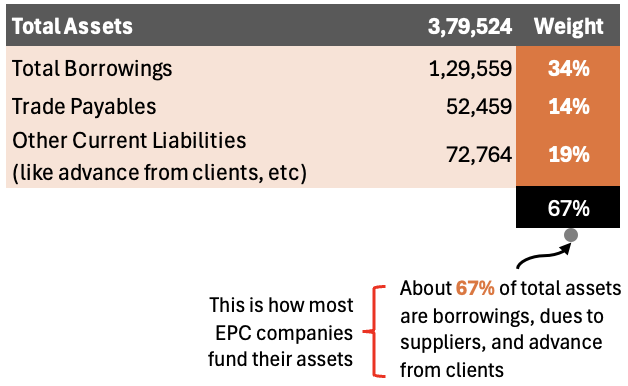
- Total borrowings: Rs. 1,29,559 crore
- Trade payables (money due for payment to suppliers): Rs. 52,459 crore
- Other Current Liabilities (like advances from clients, etc): Rs. 72,764 crore
A significant portion of these assets is funded by debt and indirectly by suppliers and clients of the project. All this funding is non-equity.
This changes the nature of asset quality. How?
Delays do not just reduce profitability; they affect cash flows and balance sheet stability. That is why I call it execution-dependent economic assets.
They can generate large value when projects run well, but their productivity is sensitive to timelines, certifications, and payment collections.
This is why asset quality cannot be judged in isolation. It varies from company to company. It must always be read alongside the nature of the business, the execution capability of the company, and how much debt is used to fund assets.
Judging Asset Productivity Without Looking into the ROE
Notice what this analysis avoided:
- No ROE calculation
- No asset turnover ratios
- No accounting theory
Instead, what we have asked here are the following:
- How much of the asset base is already earning today?
- How much is waiting on execution or approvals?
- Is the asset base funded by equity patience or debt pressure?
Pidilite scores high because most assets are already productive and equity-funded. L&T requires deeper scrutiny because many assets are work-in-progress (funded by suppliers and clients) and debt-supported.
This is why experienced investors say: ROE explains performance, but asset quality explains durability.
Step 5: Balance Sheet Over Time — Why One-Year Numbers Can Mislead
Looking at a single year’s balance sheet is like judging a business by one photograph. It tells you what exists today, but it tells you nothing about the direction.
Professional investors care far more about movement over time than about absolute numbers at any single point.
To understand this, let us place Pidilite and L&T side by side and observe how their balance sheets have evolved over the last five years.
5.1 What Changes Matter More Than Absolute Numbers
Start with shareholders’ funds, because this is the core of financial strength.
| Total Shareholders Funds | Mar-21 | Mar-22 | Mar-23 | Mar-24 | Mar-25 | Growth Rate |
| Pidilite | 5,593 | 6,404 | 7,212 | 8,407 | 9,754 | 11.77% p.a. |
| L&T | 76,992 | 82,623 | 89,326 | 86,359 | 97,656 | 4.87% p.a. |
- Pidilite’s shareholders’ funds grew from Rs. 5,593 crore in Mar-21 to Rs. 9,754 crore in Mar-25
- L&T’s shareholders’ funds grew from Rs. 76,992 crore in Mar-21 to Rs. 97,656 crore in Mar-25
In isolation, L&T’s equity base looks far larger. But the story lies in how this growth happened.
- Pidilite’s increase (at 11.77% p.a.) is driven almost entirely by retained profits. There was virtually no dilution and no dependence on debt. This is a quiet, internal strengthening of the balance sheet.
- L&T’s equity has also grown (at 4.87% p.a.), but alongside a business that requires continuous capital deployment. For sure, there is growth here too, but it must be read together with debt.
Now look at borrowings over time.
| Total Shareholders Funds | Mar-21 | Mar-22 | Mar-23 | Mar-24 | Mar-25 | Growth |
| – Pidilite | 214 | 287 | 163 | 131 | 147 | -7.20% |
| – L&T | 1,31,482 | 1,23,253 | 1,18,513 | 1,14,040 | 1,29,559 | -0.29% |
| D/E Ratio | Mar-21 | Mar-22 | Mar-23 | Mar-24 | Mar-25 | – |
| – Pidilite | 0.04 | 0.04 | 0.02 | 0.02 | 0.02 | – |
| – L&T | 1.71 | 1.49 | 1.33 | 1.32 | 1.33 | – |
- Pidilite’s borrowings were already low in Mar-21 and are almost negligible by Mar-25. Pidilite’s D/E ratio is always in the low range between 0.02 and 0.04.
- L&T’s total borrowings remain substantial, at around Rs. 1.3 lakh crore in Mar-25. L&T’s D/E ratio is at its minimum at 1.32 and maximum at 1.71 (during Mar-21 COVID phase).
This contrast is important. Pidilite’s balance sheet tells a story of reducing financial dependence. L&T’s balance sheet tells a story of debt dependence, but it is tightly managed.
Both are acceptable. The quantum of debt can mean different things in different businesses.
5.2 Signs of Quiet Improvement vs Complexity
When professionals analyse balance sheets over multiple years, they do not track the same line items for every company. The choice of what to track depends on the business model.
The goal is simple, “Identify where capital is accumulating and whether that accumulation improves or complicates the business.”
Let us see how this works using Pidilite and L&T.
Pidilite: Growth That Improves Financial Strength
For Pidilite, the most relevant long-term question is: As the business grows, does financial flexibility improve or deteriorate?
That is why we track:
- Total assets
- Cash and current investments
From Mar-21 to Mar-25:
| Pidilite | – | – |
| FY | Total Assets (Rs.Cr.) | Cash & Current Investment (Rs.Cr.) |
| Mar-21 | 8,830 | 628 |
| Mar-22 | 9,516 | 529 |
| Mar-23 | 10,525 | 858 |
| Mar-24 | 12,104 | 2,403 |
| Mar-25 | 14,011 | 3,498 |
| Growth Rate | 9.7% p.a. | 41.0% p.a. |
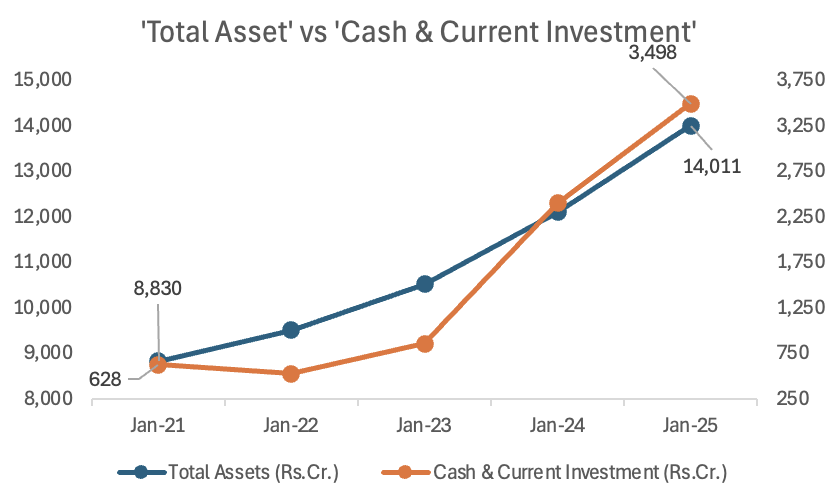
- Total assets increased from Rs. 8,830 crore to Rs. 14,011 crore (≈ 9.7% CAGR)
- Cash and current investments increased from Rs. 628 crore to Rs. 3,498 crore (≈ 41% CAGR)
This comparison is deliberate. It tells us that liquidity is growing much faster than the balance sheet itself. In other words, growth is not consuming cash; it is creating surplus cash.
This is what quiet balance sheet improvement looks like. As Pidilite scales, it does not need to stretch working capital, raise debt, or rely on external funding. The balance sheet becomes more comfortable with size, not more fragile. That is a strong positive signal for long-term investors.
L&T: Growth That Adds Scale — and Complexity
For L&T, the relevant long-term question is very different: As the business grows, does execution complexity remain under control?
That is why we track:
- Total assets
- Receivables + Other Current Assets + Loans & Advances
These three items together represent capital locked inside projects: work done, money advanced, or costs incurred that will convert into cash only if execution and collections remain smooth.
From Mar-21 to Mar-25:
| L&T | – | – |
| FY | Total Assets (Rs.Cr.) | Receivables, Other CA & Loan & Advances |
| Mar-21 | 3,11,274 | 1,41,894 |
| Mar-22 | 3,20,049 | 1,53,492 |
| Mar-23 | 3,30,352 | 1,57,283 |
| Mar-24 | 3,39,627 | 1,61,144 |
| Mar-25 | 3,79,524 | 1,71,345 |
| Growth Rate | 4.0% p.a. | 3.8% p.a. |

- Total assets grew from Rs. 3.11 lakh crore to Rs. 3.80 lakh crore (≈ 4.0% CAGR)
- Project-linked assets grew from Rs. 1.42 lakh crore to Rs. 1.71 lakh crore (≈ 3.8% CAGR)
This tells us something precise: Project-linked capital is growing broadly in line with the balance sheet, not exploding faster than the business itself.
That is an important distinction. If receivables and contract assets were growing much faster than total assets, it would indicate rising stress or loss of control. Here, growth is proportional. It is suggesting that complexity is being managed, not allowed to run ahead of scale.
This does not mean L&T is risk-free. It means risk is contained within the business model.
For such companies, balance sheet analysis over time is about monitoring discipline, not expecting simplicity.
What does the balance sheet say about the management?
Promoters and management rarely explain their real financial philosophy in words. They reveal it through balance sheet behaviour.
- Pidilite’s management consistently reinvests profits conservatively, avoids leverage, and allows cash to accumulate
- L&T’s management accepts leverage as part of the business model but works to grow equity alongside scale
Neither approach is right nor wrong. But the balance sheet makes their priorities visible without a single conference call.
The Core Lesson
One-year balance sheets can hide risk. Multi-year balance sheets reveal intent.
- Pidilite’s balance sheet shows quiet strengthening without stress.
- L&T’s balance sheet shows controlled growth with execution dependence.
This ability to read direction, not just position, is what separates professional balance sheet analysis from casual number reading.
Step 6: How to Read the Balance Sheet of an NBFC — Bajaj Finance
When you analyse an NBFC like Bajaj Finance, you must first reset your expectations.
The balance-sheet logic used for manufacturing or project-based companies does not apply here. This is because lending itself is the business.
Remember, the balance sheet does not support operations; it is the operation.
To read it properly, professionals follow a simple sequence.
Step 6.1: Identify the Core Earning Asset
For an NBFC, the most important line item on the asset side is the loan book, shown here as short-term loans and advances. This is the asset that generates interest income.
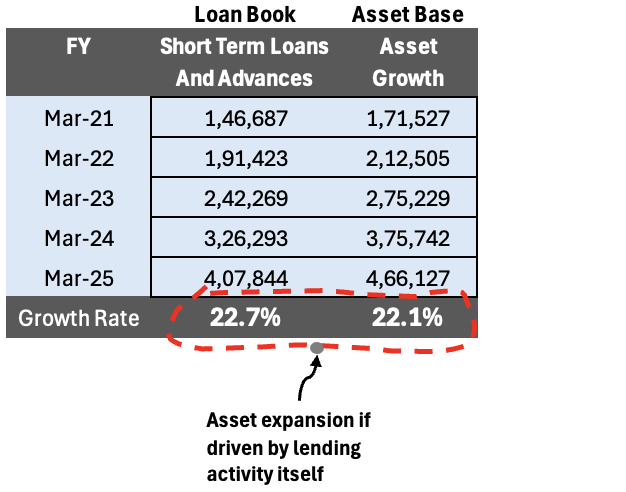
Look at how this has evolved over five years:
- Mar-21: Rs. 1.47 lakh crore
- Mar-22: Rs. 1.91 lakh crore
- Mar-23: Rs. 2.42 lakh crore
- Mar-24: Rs. 3.26 lakh crore
- Mar-25: Rs. 4.08 lakh crore
The loan book has grown at roughly 23% annually. This tells us the business is scaling primarily by lending more, not by expanding into unrelated activities.
Now compare this with total assets:
- Mar-21: Rs. 1.72 lakh crore
- Mar-25: Rs. 4.66 lakh crore
Total assets have grown at about 22% annually, almost the same rate as the loan book.
This comparison is crucial. When loan growth and total-asset growth move together, it means asset expansion is being driven by lending activity itself.
The balance sheet is not getting bloated by non-earning assets. That is exactly what a professional wants to see in an NBFC.
Step 6.2: Understand How This Growth Is Funded

Once the asset side is clear, let’s move to the liability side to see how the loan book is being funded.
Start with borrowings:
- Short-term borrowings increased from Rs. 1.32 lakh crore in Mar-21 to Rs. 3.61 lakh crore in Mar-25
This borrowing growth broadly matches the expansion of the loan book. That is expected. An NBFC borrows money in order to lend it out.
Now look at shareholders’ funds:
- Mar-21: Rs. 36,918 crore
- Mar-25: Rs. 96,693 crore
Equity has grown at around 21% annually, largely through retained earnings (reserves increased from Rs. 36,495 crore to Rs. 96,569 crore).
This step is critical for interpretation.
Professionals are not alarmed by rising borrowings in an NBFC. They focus on whether equity is growing alongside the loan book. In Bajaj Finance’s case, it is.
This tells us two things:
- Growth is not being forced by excessive leverage
- The company is continuously strengthening its capital base to absorb risk
Step 6.3: What “Asset Quality” Means in a Lending Business

In an NBFC, asset quality does not mean factories or machinery. It means the quality and behaviour of loans.
The balance sheet gives indirect clues about this.
Notice what is not growing aggressively:
- Fixed assets are only Rs. 3,818 crore against total assets of Rs. 4.66 lakh crore
- Capital work-in-progress is negligible
This shows capital is not being diverted into non-core uses. Almost all growth remains focused on lending.
Now look at liquidity buffers:
- Cash and cash equivalents grew from Rs. 2,176 crore to Rs. 13,544 crore
- Current investments stand at Rs. 34,441 crore in Mar-25
Even while expanding rapidly, Bajaj Finance is building cash and liquid investments. This indicates balance-sheet discipline and preparedness for stress.
Step 6.4: How Professionals Interpret Risk Here
Professionals do not judge an NBFC by asking, “Is debt high?”
They ask:
- Are loans growing consistently over time?
- Is equity growing to support that expansion?
- Is liquidity improving rather than shrinking?
- Is the balance sheet staying focused on core lending?
In Bajaj Finance’s case, all four conditions are met over a five-year period.
This does not mean risk is absent. It means risk is structured and supported.
The Key Mental Shift (Very Important)
For operating companies, debt creates pressure. For NBFCs, undercapitalised growth creates pressure.
Bajaj Finance’s balance sheet shows that loan growth, asset growth, borrowings, and equity are all moving in alignment. That alignment, observed consistently over multiple years, is what professionals look for when reading an NBFC balance sheet.
Once you understand this framework, financial company balance sheets will stop looking intimidating.
Conclusion
Reading a balance sheet is not about memorising ratios or spotting clever accounting tricks. It is about learning to ask better questions.
Once you start doing that, the balance sheet stops feeling scary.
Over time, you realise that strong businesses leave clear footprints on their balance sheets.
- Cash accumulates for the right reasons,
- Debt appears with a purpose, and
- Assets tell a coherent story about how the business actually works.
Weakness, on the other hand, rarely announces itself loudly. It shows up quietly, through stretched liquidity, rising dependence on external funding, or assets that look productive on paper but struggle to turn into cash.
The real skill is not in judging companies as “good” or “bad,” but in understanding what kind of risk you are signing up for.
When you can do that, the balance sheet becomes less about numbers and more about decision-making.
Have a happy investing.