Q: I’m new to stocks and super confused about why their prices go up or down.
Can you explain how stock prices work? Like, what makes a stock like Reliance’s price change?
Is it because of company profits, big investors like FIIs, or something else?
How do I know if a stock is a good buy or too expensive? For example, what’s this P/E ratio, and why does it matter?
Do I need to study complicated financial reports, or is there an easy way to predict if a stock will go up or down?
Also, if I buy a stock and its price drops, do I lose money right away?
Answer:
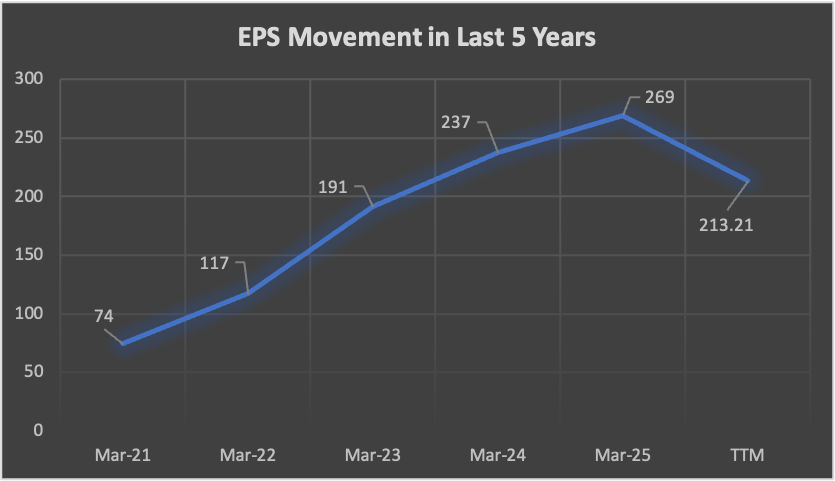
Predicting whether a stock will go up or down is tricky, but you can get a rough idea by looking at a few key things. Check if the company’s profits (like EPS) and sales are growing, as this often pushes prices up.
See what big investors (like FIIs) are doing. Their buying can lift prices, while selling can drag them down.
Also, compare the stock’s P/E ratio to its industry to spot if it’s overpriced or a bargain.
For example, if the P/E of HDFC Bank is lower than that of other private bank stocks and its profits are rising, it might be a good bet to go up.
A simple price and P/E chart comparison can give a hint about the future price movement of a stock.
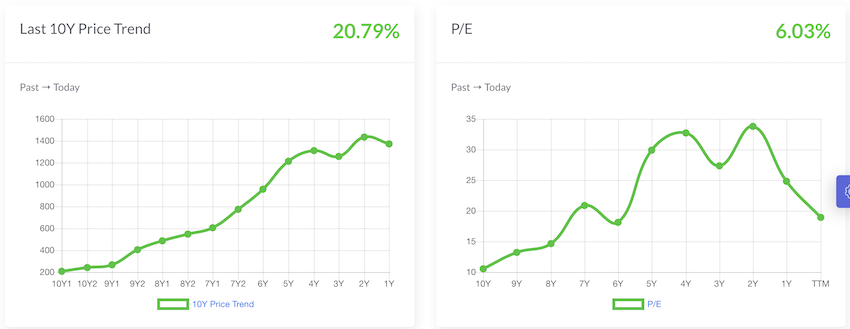
It the above two charts, you can see that, in the last two years the P/E chart is showing a steeper decline as compared to the price rise in the same period. P/E contraction is one hint that the stock is getting undervalued, hence the price can rise in times to come.
You can also use my price prediction tool to get a feel about the future stock price movement.
Stock Price Prediction Tool
Why do stock prices go up or down?
There are no easy answer to this question that why do stock prices go up or down? But for sure there are rationals we’ll discuss that can explain what works and what not.
Imagine the stock market as a big vegetable market. The price of, say, tomatoes goes up if lots of people want them and there isn’t enough supply to balance the demand. Alternatively, if nobody’s buying and there’s a ton of tomatoes, the price drops.
Stocks work in a similar way. It’s all about supply and demand.
When more people want to buy a stock (like Reliance Industries), its price goes up. When more people are selling, the price goes down.
But what makes people buy or sell a stocks is what we’ll discuss here.
What are the main drivers of the stock price?
There are three main drivers of a stock’s price:
- #1. Company Performance (Like Profits)
If a company like Reliance is making more money, its stock price will rise. Let’s say that their profits are growing because they’re selling more oil, sim cards, or FMCG sales are up. When people hear this news, they get excited. They think, “This company is doing great; why not invest in it.” So, they start buying its stocks. This surge in buying, triggered by the good news, will push the price up. In stock market, there is something more important than profits, its called EPS (Earnings Per Share). EPS is basically how much profit the company makes for each share. If Reliance’s EPS is rising, it’s a good sign the stock might go up.
- #2. Big Investors (Like FIIs)
FIIs (Foreign Institutional Investors), you can imagive are those guys who buy in bulk in our vegetable market. They’re huge organizations, like foreign banks or our mutual funds. When these people invest, they pour tons of money into their target stocks. When they buy a lot of shares in companies (say like Tata Motors or bajaj Finance), it pushes the stock price up because demand goes up. But if they start selling (like they did during the 2008 crash), prices can tumble. Why do they buy or sell? Sometimes it’s because they’re optimistic about a company or the Indian economy. Alternatively, they may sell because they need cash for something else. You can check what FIIs are doing on website of the NSE.

- #3. Market News and Events
Market news and events can also cause big swings. For example, if M&M announces a new product rollout, investors might get excited about future growth and rush to buy, pushing the stock price up. On the flip side, bad news, like a tighter government regulation on pollution norms, could scare people into selling, causing the price to drop. Global events, like rising oil prices or a major economic crisis, can also make the market to go in a sell mode. Rumors or hypes, both can effect the market.
Is there a method to predict if a stock will go up or down?
There are two ways one can predict stock price. One is by evaluation of the stock’s intrinsic value. Second is by trying to guess stock’s future PE and EPS.
Method #1: Intrinsic value estimation of a stock is a skill. Only people like Warren Buffett, and Peter Lynch can say for sure that their estimated intrinsic value is accurate. Balance all of us can only make a random guess. I’ve developed an MS EXCEL based tool which can estimate intrinsic value of stocks. Check the below infographics to know how it works.

Method #2: This is a second method which a beginner can use to predict if a stock will go up or down. This is a crude way to guessing a stock price. But the logic’s that will be used to implement the process is sound. I’ve personally used it to guess price trends during my earlier days. I’ll share the procedure in detail for only academic knowledge of my readers.
2.4 Future PE-EPS Method

This method of predicting future price of a stock is based on a basic formula. The formula is shown above (P/E x EPS = Price).
According to this formula, if we can accurately predict a stock’s future P/E and EPS, we will know its accurate future price.
We use this formula day-in day-out to compute financial ratios of stocks. But instead of future price, we use it for current price. Here the P/E and EPS data that we use is based on trailing four quarters.
We will use the same formula and try to predict future price. How to do it? Please check the 3 step process shown below. We can also use this method to crudely quantify if the current stock is undervalued or not (check the conclusion).
But before that, let’s know how to predict future price of stocks.
Step #1
Estimate P/E of Future (P/E after 3 years from today)
- #1A. Historical Price: First note down monthly price of stock posted in last 3 years. You can get the price history from investing dot com. This website allows you to download the historical price in csv format. You can follow this path: Go to your Stock Page > Historical Data > Time Frame (monthly). Download the last 3 years price (36 months) for your stock. Check this video guide where price downloading is shown.

- #1B. Quarterly EPS (EPS Q): After price, we will need the stock’s historical EPS data. This data we can get from the stock’s page in moneycontrol. You can follow this path: Go to your Stock Page > Financial > Quarterly Results. Note down the quarterly EPS for last 3 years (12 quarters). Read about high EPS companies.

- #1C. Calculate Last 4 quarter EPS (EPS-4Q): Calculation of last 4 quarter EPS is easy. First prepare a table of all 12 quarter EPS you have collected from moneycontrol. To calculate last 4 quarter EPS, just add the EPS of last 4 quarters. Please see the below table prepared for an example stock.

- #1D Calculate Last 3Y P/E: From the above prepared table, P/E calculation of stock in each of the last 3 years is easy. PE can be calculated by dividing Price (P) by last 4 quarter EPS (EPS-4Q). The same is represented in the calculation table shown below:

- #1E Estimate P/E of Future: Before estimation we will make an assumption that the stock is going to at least replicate in past 3 years performance (if not improve it). What we will do? We will calculate the Average P/E of last 3 years. Now we will assume that the stock will have this P/E after 3 years from today (calculated value is 21.25). Our assumption: After 3 years from today, the stock will have a PE of 21.25. Read more about P/E ratio.

Step #2
Estimate EPS of Future (EPS after 3 years from today)
- #2A EPS Growth Rate: In this step we will estimate the growth rate at which the EPS of our stock will grow in next 3 years. How to do it? We will have to fetch some data from moneycontrol. After the data is fetched, we must calculate the growth rates of the fetch data. Based on this calculation will be estimate future growth rate of EPS. See the sample calculation shown below. Here the estimated EPS growth rate is 1.72% p.a.

- #2B Estimate EPS of Future: We have two numbers to this estimation. We know last 4 quarter EPS. We have also estimated the EPS growth rate for the next 3 years time horizon. We will use these two numbers to estimate EPS of the stock after 3 years from today. Check the formula used for future EPS calculation. Read about profitable stocks.

Step #3
Predict Future Price of Stock
We will use the PE-EPS formula to predict future price of stock. What we have done in step #1 and Step #2 above is estimation of Future P/E (21.25) and Future EPS (93.28). With two numbers in hand, we are now ready to apply them to our formula.

What can we conclude from the above numbers?
- What will be the future price? The expected future price (after 3 years) of our example stock is Rs.1,982.2 We have arrived at this by using the P/E formula (PE x EPS = Price).
- What is the current price? The current price of the stock is Rs.1,737.8 (see snapshots used in PE calculation above).
- At what rate will the price grow? The current price of stock is Rs.1,737.8. The expected future price is Rs.1,982.3 (after 3 years from today). It means the stock is expected to grow at a rate of 4.48% per annum. Use this formula for growth rate calculation: [(future price/current price)^(1/ years) – 1].
What Happens If I Buy a Stock and Its Price Drops?
If you buy 10 shares of Zomato at Rs. 200 each (total Rs. 2,000) and the price drops to Rs. 150, you haven’t actually lost money unless you sell.
The loss is just on paper (called an “unrealized loss”).
If you hold onto the shares and the price climbs back to Rs. 250 later, you’re in the green.
But if you sell at Rs. 150, you’d lose Rs. 500 for real.
The key is to buy stocks you believe in for the long term. If Zomato’s growing its food delivery business and making more money, a temporary price drop might just be near term anamoly.
Conclusion
Access the price data, and financial report of your stock as suggested in the above article. You can use these numbers to predict what will be the future price of stock – after 3 years from today.
One can also use these numbers to interpret if the current price of your stock is undervalued or overvalued. This understanding can also give a hint that at current price levels, the stock shall be purchased or not. How to make this decision? Read about companies with a high moat.
Suppose your expected ROI is 12% p.a. from a stock. Hence you did its price trend analysis as shown above. You discovered that the analyzed stock can yield a return of 4.48% p.a. in the next 3 years. As the stock’s yield is below your expectations, hence for you, this stock is overvalued.
Suggested Reading:
- Investment basics for beginners.
- How a beginner can start investing money?
- Stock Investing Strategies (5 Tips)
- What is the right time to buy stocks for long term?
Have a happy investing.


![How Wealth Accelerates After Reaching One Crore [Compounding]](https://getmoneyrich.com/wp-content/uploads/2024/09/How-Wealth-Accelerates-After-Reaching-One-Crore-Thumbnail-300x173.png)


I have purchased 5 shares thru emargin.
Would like to know whether its good way of investment?
How long should I hold ? What should be roi?
Just remember that investing with margin involves risks, and it’s essential to understand the terms and fees.
Are you new to equity?
Hi,
For the record surely the reverse of your statement is true;
“We want to know if, from the current price levels, a stock will go up or down. The best indicator of this is stock’s fair price. When fair price of a stock is below its current price, the stock has good possibility to go up in times to come.”
Mani:
Is all the info needed to come up with a calculation of the future price of an index such as the NDX [Nasdaq 100) or the DJIA (Dow Jones Industrial Average) available?
All companies in the NDX are required to issue quarterly earnings reports. In addition to each companies quarterly earnings, one would need to know each companies quarterly price.
Have you or anyone else applied your method of forecasting future price using an index fund?
This would involve coming up with a modified market cap weighted EPS for all 100 of the tickers in the NDX, no small calculation!
It perhaps would be easier to use the DJIA, which is price weighted and only has 30 stocks.
Don
Step 2 – please help to get details calculation. Growth rate calculation based on balance sheet and profit & loss account..
This was a very good article of writing. Real nice a simple for a beginner or novice. Thankfully I graduated with a finance degree in 1984 and keep myself informed and up to date. This was informative. Thank you
Hi Mani.
I jave a question:
How you did calculate the weightage in step #2?
Dear Mani, I am a retired army person. I read your valuable article that how to predict future price of a STOCK for this calculation you use three years historical data of TCS (17 May 2017 to 20 April 2020)PE and EPS. As per calculation.
Current Price of TCS Share as on 20 Apr 2020 =1737.80
PE =21.25
EPS =93
Future Price of share in coming 3yrs PE*EPS (21.25*93) = 1982.20
But dear Sir this formula is not matched with present price of TCS there is big difference between future price and present price of TCS share. Present price of share is your future price. To day 26 Apr 2022 price of TCS share is 3546.30 closing rate.
his talking for an average calculation..so it is great current price is greater than you expected.
can someone please explain why it is overvalued at the end. Surely if its going up in value then its undervalued?
Hi
Could you please explain how to compute 10.52% in #2A EPS Growth Rate:
I am sasanka from sri Lanka.
Thanks
Sasanka
I have similar question. I also would like to know how this number is generated as well.
how we get 10.52% growth rate and weightage 20%.
please help reply if you see our questions, Mani.
Sir I need help I want to write article about stock market prediction using fuzzy what can I do sir
Really nice blog there for all the beginners in the market for investments. Ideas shared for analysis are the best.
Dear Mani thank you for ur valuable information … Pls guide for Step 2# what is the formula
It’s the CAGR formula
I am a 14 years old kid. After analyzing this article. do you think I can now go and be involve in stock? i’ve always wanted to be involve in stock market.
First try predicting the future stock price trends. If you successfully predict the trend 3-4 times you are good to dive in the world of stock market. I will recommend investing a small amount of money at the beginning.
No. Have a clear aim of your life. Proceed towards it by choosing appropriate carrier. Finish your study and then enter after securing your comfortable maintenance. This is as I feel
Pls suggest EPS & PE calculations for months forcasting
just a great article to know what could be the actual price of a stock in simple language and to remove noise created by news channels and so called analysts
Hi Mani,
Thanks very much for the information. This info is very useful to me.
Unfortunately, I lost at step #2A. Can you please share the formula for Growth rate per quarter (eg: 10.52%) and Weightage (eg:20%) per quarter for P&L, BS, and CF statement?
Thanks in advance.
How can we estimate the 3-year future PE? As per my knowledge, we cannot even consider the average of PE because it is recorded on a daily basis of price fluctuation.
You are right. No one can never predict future movements.
But idea is to make an educated guess. All valuation models are based on this theory.
What has been explained above is what I’ve used during my initial days of investing (and it worked for me reasonably well). At least I was not investing blindly.
Hi Mr.Mani,
Thanks for sharing knowledge and info with us.much appreciated.
I was simulating the above process for Ashok Leyland but results are not agreeable.could you let me know the reason for such anamoly.
Thanks & Regards,
Paul
I bought your worksheet. That’s splendid effort. Hope you would have spent quiet a time to build this. Superb.
Is there a way that we unlock few sheets to know what was behind for research purpose.
If yes, do you charge for it? How much? Can you please update me.
Thanks for your feedback.
Sorry but the worksheet should remain protected.
I have bought your Share Analysis spread sheet and have been studying it for the last 2 weeks. THANK YOU very much for building such a wonderful tool.
When I worked on 10 odd shares I find that current price of all the shares are 1.5 to 2.2 times their Intrinsic Value” This is despite a 30% fall in the market. By that logic none of the shares of Credible companies can be bought.
When I received your mail today I tried to build an excel spreadsheet to calculate the Projected Price after 3 years.
I tried to mirror your example of TCS. All the figures are matching except Current Asset and Total Assets. Please check
My analysis of TCS is dated. Your’s is based on recent data.
Just because prices has fallen by 30% don’t mean that the shares are trading below its intrinsic value. This is the utility of using the worksheet like this. It gives you a visibility (which is not evident otherwise)
Sir , at this time L&T stock r low p/e ratios and low valuation ?
Is it real time for investment this stocks as a biginers ….!
If I can hold for 2 years then what kind of results I expect…
Kindly explain….
You can do this analysis using the ideas shared in this article.
This is a great article… thanks for providing such a valuable and useful information….
Hi Your blog is amazing this is like online classes for stock investing.
1 query, should we take standalone data or consolidated data for analyzing the company/stock?
I prefer analysing the core business using standalone data. Thanks.
Hello, Will Mar’19 EPS not be for Jan ,Feb and Mar 19? But in your calculations you have taken Mar’19 EPS for Mar,April and May. Please explain?
Companies report EPS every quarter (like Dec, Mar, Jun, and Sep). So, if EPS is declared in Mar, the same EPS has been considered for the next two months (Apr and May).