Query: I have started investing in stocks very recently.
I want to learn how to pick good companies for the long term.
But I’m confused about a few terms like net profit, EPS, P/E ratio, and price valuation.
Individually, I know what are these metrics, but I want to know how they are related and how, coming together, they can help in stock analysis.
Using these metrics, is it possible to figure out if a stock’s price is fair or not?
Basically, I want to know how do all these connect to help me decide which stocks are worth investing in for years?
Answer:
There is always an excitement and confusion attached to the stock market when comes to how to pick solid companies for the long haul.
It is easy to find companies who know about the related terms like net profit, EPS, P/E ratio, and price valuation. But figuring out how these metrics connect with each other is not as easy.
In this post, I’ll try to make it easier for you to correlate how these terms are interrelated and how they can help in the stock analysis.
1. How These Metrics Work Together
Imagine you’re buying a fruit stall in the vegetable market near your house.
To judge how much to pay to buy it, you would like to know the following:
- How much money it makes as profits,
- How that profit translates to each share you own (EPS),
- Whether the price you’re paying for the stall is reasonable compared to its profits (P/E ratio), and
- Whether the stall’s overall value justifies the price that you are paying to buy it (price valuation).

Net profit, EPS, P/E ratio, and price valuation are those key metrics (there are many others too), you can use to analyze stocks.
Each tell you something about a company’s financial health and whether its stock is a good deal or not.
When used together, they give you a clear picture of whether a company is worth the purchase for long-term investment.
Let’s dive into how these metrics are interconnected and how they guide you in stock analysis.
We’ll use a the Reliance Industries (RIL) as our example company.
Step 1: Net Profit – The Foundation of Financial Health
Net profit is the money a company has left after paying all its expenses, taxes, and interest.

It’s the starting point because it shows how profitable a company is at its core.
Without a solid net profit, a company can’t grow, pay dividends. Why?
- Because it is the profits that the company can reinvest back into its business to grow.
- Moreover, the dividends are paid from the accumulated profits of the company.
Both, growth and dividends are two critical factors for the long-term investors that they see to buy and continue holding the stock.
Why Net Profit Matters in Stock Analysis
Net profit is like a raw material for all other metrics like EPS, P/E, etc. It even forms a basis for doing a more detailed price valuation analysis.
Net Profit strongly influences how investors perceive a company’s value.
A consistently growing net profit signals towards a company that is managing its selling its products well, and in doing so is also managing its costs efficiently. Such companies are likely to survive economic ups and downs more professionally than others.
As an investor, this is the most important parameter for us in a company that we are considering for long term investing.
Example: Reliance Industries (RIL)
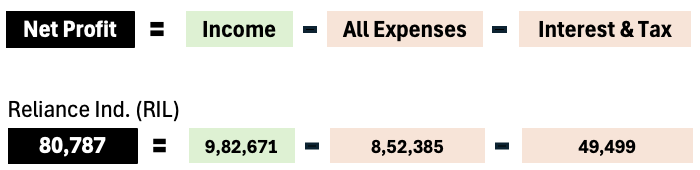
In FY 2024-25, Reliance Industries reported a consolidated net profit of approximately Rs. 80,787 crore (as per their annual report).
This tells us Reliance is highly profitable, but how does this translate to you as a shareholder?
That’s where EPS comes in.
[Note: Net Profit of RIL, net of minority interest, is about Rs. 69,649 crore. To know what is minority interest and why it matters, read this blog post.]
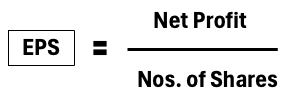
Step 2: EPS – What is Your Share of The Total Profit?
We’ve seen in our previous example that, RIL has made Rs. 80,787 crore in net profit (or Rs. 68,649 as net or minority interest). But how much of it is will go into your pocket?
To understand it, we’ll have to calculate the EPS of the company.
Earnings Per Share (EPS) takes net profit and divides it by the number of outstanding shares, showing how much profit is earned per share of stock.
It’s like dividing the company’s profit into many smaller parts and seeing how big is the piece for every shareholder of the company. To understand this, consdier that there is a company which has 10 partners. If this company makes Rs. 10 crore in net profit, then each partner’s share of the profit will be Rs. 10 crore.
A slightly modified formula of EPS is as shown below. It takes into account the preferred dividend component (if applicable).
EPS = (Net Profit – Preferred Dividends) ÷ Number of Outstanding Shares
How EPS Connects to Net Profit
EPS directly depends on net profit. But growth in net profit does may always mean a growth in EPS. To understand this you can read about share diltution in this blog post.
For example, if Reliance’s net profit grows, its EPS will likely increase in the same proportion. But for this to happen, the number of shares stay the same. Generally, as the net profit grows, company issues more shares (dilution) causing a dip in EPS even though the net profit has grows.
A rising EPS over time suggests the company is generating more profit per share, which is a good sign for long-term growth. Growing EPS is also a sign that the company values shareholder’s value. It is a big thumbs up for the company’s quality of management (from the shareholder’s perspective).
If net profit of a company falls, EPS will fall not matter if the company will issue new shares or not.
Example: Reliance Industries
Let’s say Reliance’s net profit is Rs. 80,787 crore, and it has about 1,353.24 crore shares outstanding. Let’s assuming no preferred dividends for simplicity:
EPS = Rs. 80,787 crore / 1,353.24 crore shares ≈ Rs. 59.7 per share.
This means every share you own represents Rs. 59.7 of Reliance’s profit.
If EPS grows year after year (e.g., from Rs. 55 to Rs. 59.7 over a few years), it’s a sign Reliance is becoming more profitable. Such an EPS grown is making it attractive for long-term holding.
The point is, for long term investors, a standalone EPS is less important than the EPS trend. A growing EPS is what shareholders would like to see.
Now, that we have the EPS, the next question is, is the stock’s price reasonable as compared to it EPS?
That’s where we will need the P/E ratio to do the valuation analysis.
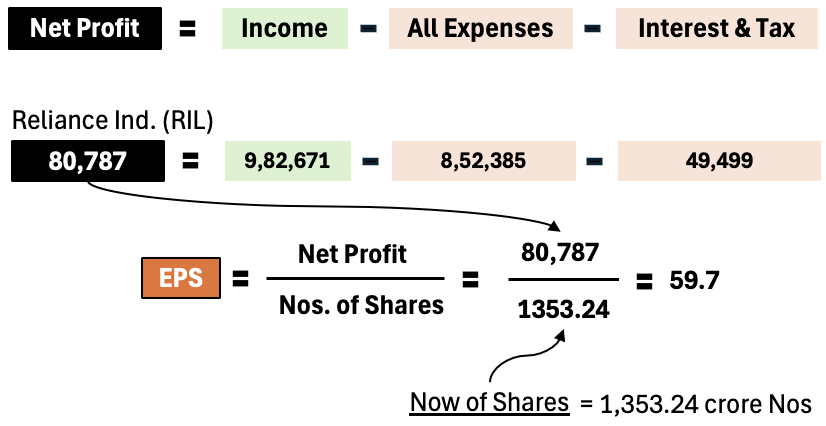
Step 3: P/E Ratio – Is the Price Worth the Earnings?
The Price-to-Earnings (P/E) ratio tells you how much you’re paying for each rupee of a company’s earnings.
It’s a key measure of whether a stock is priced fairly relative to its profits.
Following are the rule of thumb we can remember with respect of P/E ratios of stocks:
- PE15: A P/E mutiple of 15 for an average company is considered good.
- PE35: A P/E mutiple between 15 and 35 is considered good for an average growth company.
- PE15: A P/E mutiple below 150 is considered good for a very capital intensive company.
- PE35Plus: There are companies which trade at P/E multiple of 35 and above. Generally speaking, such companies we can treat as overvalued. But companies whose cash flow is fast and predictable demands high P/E multiples. Also, new age companies, which are less profitable but has potential to grow fast in decades to come can also have a P/E ratio higher than our PE35 rule.
Formula:
P/E Ratio = Current Stock Price / EPS
How P/E Ratio Ties to EPS and Net Profit
The P/E ratio builds on EPS, which comes from net profit (see the above formula for visualization).
Let’s take example of Indian bank stocks to understand the concept of P/E ratio.
- Private Banks: These banks trade at an average PE16.5 levels.
- Government Banks: These banks trade at an average PE10.
If any bank stock trades at a higher PE mutliple than above, it can mean two things:
- Either the stock is overvalued, or
- It is a sign that the investors expect faster future growth rates in these stocks. Hence, they’re willing to pay more for each rupee of earnings (EPS).
Similarly, a low P/E could suggest the stock is undervalued. Or, the company is facing some challenges.
Since EPS is derived from net profit, a growing net profit boosts EPS, which can lower the P/E ratio if the stock price doesn’t rise as fast as the EPS. This is a strong indicator of a potential bargain buy.
Example: Reliance Industries (RIL)
Suppose Reliance’s stock price is Rs. 1,365 per share, and its EPS is Rs. 59.7 per share
P/E Ratio = 1,365 / 59.7 ≈ 21.77
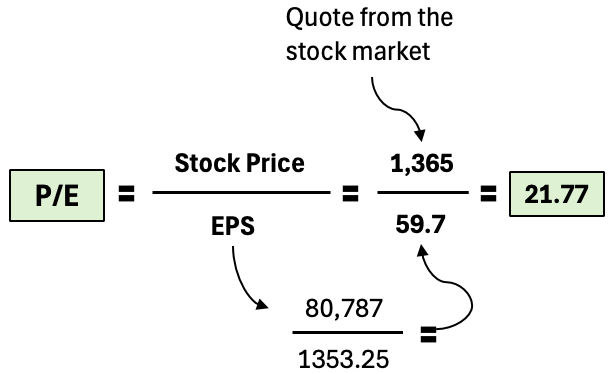
A P/E of 21.77 means you’re paying Rs. 21.77 for every Rs. 1 of Reliance’s EPS. Is it a good deal?
How to answer this question? To answer, you need to compare:
- Industry Average: The oil and gas or conglomerate sector in India might have an average P/E of, say, 20. Reliance’s higher P/E could mean investors expect faster growth (e.g., in Jio telecom, Jio Finance, Reliance Retail, etc).
- Historical P/E: If Reliance’s P/E was 30 last year, a drop to 21.77 might suggest the stock is relatively cheaper now.
- Competitors: Compare with peers like ONGC (P/E ~8.4) or OIL India (P/E ~10.2). A higher P/E than ONGC & OIL India suggests Reliance is priced aggresively. The reason for that may be is the diversified nature of RIL. It is not longer only an Oil Exploration or an Oil refining company.
P/E ratio is a very useful price valuation tool. It gives is a quick idea that if the stock we are referring to is available expensive or cheap. But P/E story must be interpreted with a context. This is where it gets complicated.
Normal retail investor are often not equipped with the latest flow of news (or the details of the business) to built a useful context.
Hence, a P/E ratio alone doesn’t tell the full story.
A low P/E might mean a stock is undervalued, but it could also signal slow growth or risks.
A high P/E might mean overvaluation, but it could reflect strong future potential (e.g., tech companies like Infosys often have higher P/Es).
Hence, it is essential to combine P/E with other metrics to get a more accurate understanding of valuation. You can read this detailed blog post to lean about the P/E ratio.
Step 4: Price Valuation – Is the Stock Price Fair or not?
P/E is a reasonable valuation metric, but if we’ll refer only the standalone PE number, without context, there are changes to building a wrong interpretation.
So, the suggestion is, though net profit, EPS, and P/E are good metrics, but it must be understood more deeply.
Price valuation is about determining whether a stock’s current market price reflects its true worth.
For long term investors, the big question is: “Am I paying too much, or is this a bargain?” Net profit, EPS, and P/E ratio all can feed into valuation analysis and generate the answer for us.
How These Metrics Connect to Valuation:
- Net Profit: A strong, growing net profit supports a higher valuation because it shows the company can generate cash to reinvest or pay dividends.
- EPS: A rising EPS increases the company’s intrinsic value (what it’s fundamentally worth), as each share represents more profit.
- P/E Ratio: Helps you gauge if the stock’s price is reasonable compared to its earnings. A P/E much higher than peers might suggest overvaluation; a lower P/E might indicate undervaluation.
To assess if a stock’s price is fair, you can also use these metrics in a valuation method like the Discounted Cash Flow (DCF) model or Relative Valuation:
- DCF: Estimates a company’s future cash flows (tied to net profit) and discounts them to today’s value. If Reliance’s intrinsic value per share (based on future profits) is Rs. 1,000 but it’s trading at Rs. 1,300, it might be overvalued. Use this online DCF Calculator.
- Relative Valuation: Compare P/E ratios across similar companies. If Reliance’s P/E is lower than TCS’s but its net profit and EPS growth are similar, Reliance might be a better buy. Read here to know how to practice relative valuation.
Example: Price Valuation of Reliance
Let’s say you’re doing a price valuation of RIL:
- Net Profit Growth: Reliance’s net profit grew from Rs. 53,223 crore in FY 2020-21 to Rs. 80,787 crore in FY 2024-25. This is an absolute growth of 51.7% over five years or 8.7% per annum. For a company of RIL’s size, it is a decent bottomline growth rate.
- EPS Trend: In the same period (5 Years), the EPS of RIL grew from Rs. 36.04 to Rs. 51.468. This is an absolute growth of 41.7% and a CAGR of 7.22% per annum in last 5 years.
- P/E Comparison: Reliance’s P/E of 25.66 is higher than ONGC (P/E ~8.4) or OIL India (P/E ~10.2). Given Reliance’s diversified business (oil, telecom, retail), this P/E seems reasonable but not cheap.
- Valuation Check: Using a simple relative valuation, if the sector average P/E is 20, Reliance’s “fair” price might be 18 × Rs. 59.77 = Rs. 1,075. At Rs. 1,300, it’s trading above this, suggesting possible overvaluation. But it you believe Jio or retail will drive exceptional growth, then the current Reliance’s PE may start looking reasonable.
To estimate fair value, one must use a P/E-based rule of thumb (as descibed above).
You can also multiply EPS by the industry-average P/E to get a fair price indication.
Note: Always factor in growth prospects to interpret the P/E multiple. For example, Reliance’s investments in green energy might justify a premium.
Putting It All Together: Stock Analysis for Long-Term Investing
Now, let’s see how these metrics work together to help you pick stocks like a pro.
Imagine you’re comparing two Indian companies: Reliance Industries and HDFC Bank.
- Check Net Profit:
- Reliance: Rs. 80,787 crore (FY 2024-25), growing steadily at 7.22% per annum due to diversified revenue streams.
- HDFC Bank: Rs. 70,792 crore (FY 2024-25), growing at a much faster growth rate of 17.33% per annum. But it being tied to banking sector, it will face risks like loan defaults.
- Insight: Both are profitable, but Reliance is good in terms of diversified business, and HDFC Bank is growing much faster as compred to Reliance.
- Analyze EPS:
- Reliance: Rs. 59.7, up at the rate of 7.22% in five years.
- HDFC Bank: Rs. 93, up at the rate of 9.9% in five years.
- Insight: HDFC Bank’s EPS growth is slightly stronger, suggesting better per-share profitability ehancement.
- Compare P/E Ratios:
- Reliance: P/E of 21.77, looks reasonable considering its size, energy exposure, and it being a conglomerate with growth in telecom and retail.
- HDFC Bank: P/E of 21.1, high considering the average PE16.5 rule for private banks. But both ICICI Bank and HDFC Bank have always enjoyed the premium compared to other Indian banks.
- Insight: HDFC Bank might be “cheaper” relative to earnings and its growth. But Reliance’s higher P/E could reflect growth potential.
- Assess Price Valuation:
- Reliance: It is trading at Rs. 1,300 is higher that its fair price of Rs. 1,075.
- HDFC Bank: Using the banking sector’s average PE16.5, HDFC Bank’s fair price might be 16.5 × Rs. 46 (after split) = Rs. 759. HDFC Bank is currently trading at Rs. 960, it’s slightly overvalued.
- Insight: In terms of pricing, I think both stocks may look slightly overvalued at currently levels, but from these price levels, I think both these stocks are point to render a CAGR of about 14% if one can hold them for next 5-6 years at at stretch.
Decision Making
You can see, how you can build a perspective about a stock’s price valuation by looking together at its net profit, EPS, and P/E.
If you are not comfortable in collecting such data and doing this type of analysis, you can take help of the Stock Engine’s. This is a stock analysis tool that can help you build a perspective about a few selecte stocks.

Practical Steps To Do Price Valuation By Oneself
- Find the Data: Check net profit, EPS, and P/E ratios on platforms like BSE India. Look at annual reports for net profit and EPS trends.
- Compare Peers: Use P/E ratios to compare companies in the same sector (e.g., Reliance vs. ONGC, HDFC Bank vs. ICICI Bank).
- Look at Trends: Focus on companies with growing net profit and EPS over 3-5 years for long-term stability.
- Validate Valuation: Use P/E-based estimates or basic DCF tools (check this online DCF Calculator) to check if the stock price is fair.
- Building a Wider Perspective: Don’t rely on these metrics alone. Check profitability, management quality, financial health, economic moat, and overall growth etc get a 360 view of the company.
Conclusion
Net profit, EPS, P/E ratio, and price valuation are like pieces of a puzzle that, when combined, help you see if a stock is worth holding for years.
- Net profit shows the company’s profit power,
- EPS translates that to your share,
- P/E ratio gauges if the price is fair, and
- Price valuation ties it all together to assess if you’re getting a good deal.
By analyzing these metrics together, as we did with Reliance and HDFC Bank, you can take a better call about which company is likely to grow your wealth over time.
Have a happy investing.