Fair Value Calculator – ROE and P/B Ratio Method
Table of Contents
Introduction
I recently watched an insightful podcast featuring Anup Maheshwari. He is a manager with over 30 years of experience in the stock markets. His explanation of fundamental analysis, particularly the relationship between Return on Equity (ROE) and Price-to-Book (P/B) ratio, was quite interesting.
Stock investors can often find themselves tangled in financial jargon of the market. But Anup’s simple explanations of understanding a business with respect to how the capital is allocated resonated with me.
I’ll share my key takeaways from the podcast.
But my main focus will the math behind ROE and P/B relationship as highlighted in the video.
But before that, let’s start with the core concept of fundamental analysis of businesses.
1. Why Fundamental Analysis Matters
Stock picking can feel like travelling in a Mumbai local train during rush hour. It can be overwhelming and risky if you don’t know the route.
Anup stresses that fundamental analysis is simpler than it seems.
It’s about understanding a company’s ability to generate profits on the money invested in it. This is where ROE and P/B come in.
They help us gauge whether a stock is worth our hard-earned rupees.
But before we get to the math, let’s set the stage with Anup’s core idea, investing is about allocating capital wisely.
Start-up Analogy
Imagine you have Rs.10 crores.
You could invest this capital in a safe 10-year government bond. This is the safest long-term investment option that will fetch you 6% return per annum. No hassle, no stress.
In case you want highe returns than 6%, you’ll have to do more.
You could invest it in a business that promises 15% returns.
But there is a catch here. Businesses are not as safe as a government bond (G-Sec). They cannot promise you a stable return like a bond.
Starting a business involves a lot of effort and dealing with risks. Both of them come as a package.
So the question is, why take so much risks and efforts? The answer is in the extra 9% return (6% + 9% = 15%). This alpha (extra returns) is what creates value and motivates people to start a business.
This is the essence of capital allocation, choosing where your money works hardest.
2. The Power of ROE
ROE is the star of the show.
ROE measures how much profit a company makes for every rupee of its net worth (or equity).
ROE is like the grades a business earns over a time span of one year. A high ROE means the company is efficient at turning capital into profits.
Anup says ROE is the most important variable because it drives a company’s value.
Take a company like Nestle.
It boasts an ROE of over 90% because its strong brand requires little capital to generate huge profits. Compare this to Hindalco, an aluminum manufacturer. Its ROE is most volatile, varying between 20% in good years, near zero in bad ones like 2016. Why?
It’s a cyclical business tied to economic ups and downs.
Anup’s point is very stratight forward, an investor must understand a company’s ROE profile before investing in them. ROE profiling says a lot about the business. A steady, cyclical, or growing company will have these characteristics visible in their ROE history as well.
Having this clarity is essential before one can go ahead and buy stocks.
3. The Math Behind ROE and P/B
Now, let’s get to the part that I want to share with you.
How does a 15% ROE translate to a P/B ratio?
Anup mentions a “rule of thumb” that a 15% ROE typically results in a P/B of about 3x.
But why? Under what conditions might it be 2x or lower?
Let’s understand the derivation of this thumb rule using some math. I’ll try to keep it as simple so that even non-math guys can get the feel of it.
What is P/E ratio? It is the market value of a company (market cap) divided by its book value (net worth).
Case #1: ROE 15%, P/B 3X
For example, if a company “ABC” has Rs.10 crores in book value and its market cap is Rs.30 crores, its P/B is 3.
Now, if the Gordon Growth Model links ROE to P/B. Allow me to show you the calculations.
P/B = (ROE – g) / (COE – g)

Here I’m assuming the following values:
- ROE is 15% (0.15).
- COE (Cost of Equity) is the return investors expect, say 10%. Logic is, 6% is risk-free rate from government bonds plus a 4% risk premium.
- The growth rate ( g ) depends on how much profit the company reinvests. If it reinvests 50% of earnings (retention ratio = 0.5), then ‘g’ would be as below:
g = ROE * Retention Ratio = 0.15 * 0.5 = 0.075 = 7.5%
Plugging into these values in the P/B formula:
P/B = 0.15 – 0.075 / 0.10 – 0.075 = 0.075 / 0.025 = 3

This matches Anup’s rule of 15% ROE gives a P/B of ~3x.
Case #2: ROE 15% P/E < 2X
Let’s take another example, and this time we’ll integrate the concept of price valaution.
There is another company (XYZ) whose market value is about Rs.30 crores for a Rs.10 crore book value and its ROE is 15%. The cost of equity (COE) is also same as before, 10%.
In terms of market valuation, the company’s P/B value ratio is 3X.
P/B = Market Cap / Net Worth = 30 / 10 = 3
Now, let’s estimate if the above calculated P/B is supported by the company’s valuation or not.
Yes it is possible. The fair P/B ratio of the company can be lower than its marke P/B ratio. How this will happen? When growth is low or risk is high.
Suppose the company XYZ pays out 80% of its earnings as dividends. Now, this leaves only 20% for reinvestment. In this case, the growth rate (g) will be only 3%.
g = ROE * Retention Ratio = 0.15 * 0.2 = 0.03 = 3.0%
Plugging into these values in the P/B formula:
P/B = (0.15 – 0.03) / (0.10 – 0.03) = 0.075 / 0.025 = 1.715
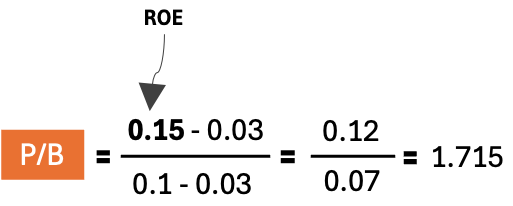
What we have done here? A company whose ROE is 15%, COE is 10%, and which is growing at a rate of only 3%, its fair P/B ratio should be 1.715 (below 2).
For the same ROE and COE, the company ABC’s fair P/B was 3 and for XYZ’s fair P/B is 1.715. It means that, if the market P/B of XYZ is 3, it is trading at overvalued price levels.
Why is this variation coming? It is because of the low growth rate of XYZ. Low growth reduces valuation.
Case #3: ROE 15% P/E < 2X
Let’s see one more variation to our company ABC.
- ROE is 15% (0.15).
- COE (Cost of Equity) is the return investors expect, say 12%.
- Reinvestment Rate is 50%.
Here we are assuming that for the same compant (ABC), the COE goes up to 12%.
Now, let’s estimate how this COE (Cost of Equity) variation effect the fair P/B ratio.
P/B = (0.15 – 0.075) / (0.12 – 0.075} = 0.075 / 0.045 = 1.67
Case #4: Hindalco
In the video podcast, Anup gives the example of Hindalco in 2016.
At that time, Hindalco’s ROE was near zero. Hence, at that time it was trading at 1/3rd of its book value (Rs.80 per share vs. Rs.240 book value).
What does it mean?
If the current ROE of a company is low (like in case of Hindalco’s 2016 case), the market will assume that this low ROE would persist. Hence, at that time its P/B ratio fell to such low multiples (1/3rd).
[Remember: Metals stocks have a cyclical business where profits fluctuate between highs and lows.]
But when the ROE of the same company (like Hindalco) would rise to say 15-20%, the P/B would also rise to 3x multiples.
So, one learning is very visible. The way to buy a cyclical stock is to buy them when the P/B is low. In those times, the stock is available at undervalued price levels.
4. Why P/B is More Useful Than P/E and EPS As A Valuation Metric
Anup isn’t a fan of the Price-to-Earnings (P/E) ratio or Earnings Per Share (EPS). Why?
Earnings are volatile. During COVID, stock prices fell, but earnings crashed even more, making P/E ratios look high despite stocks being cheap. P/B, on the other hand, is tied to book value, which stays stable.
It’s like comparing a shaky bamboo bridge (P/E) to a concrete one (P/B).
P/B also connects directly to ROE, the core driver of value.
A 15% ROE means a predictable P/B of ~3x. But on the other hand, P/E can swing wildly.
Anup recalls the 1990s when investors obsessed over P/E and EPS, ignoring ROE. This led to overpaying for stocks like IT firms during the dot-com boom.
P/B is unarguably a simpler and more reliable ratio that we retail investors can use with more certainly as a way to to fair value estimation of stocks.
5. Lessons from Cyclical and Growth Stocks
Cyclical stocks like Hindalco are roller coasters. Their ROE and P/B soar in good times and crash in bad ones.
Hence, timing matters while picking such stocks. We must buy them at a low P/B (like below 1x) in a downturn market. If we want to sell, we can do it when the P/B ratio becomes close to 3x (in an upswing).
Following this method, one can make very good returns from cyclical stocks as well.
How Growth Stocks Are Different?
Growth stocks like Bajaj Finance are different. This is how Anup explains it in the podcast.
In 2008, the ROE of Bajaj Finance was 4-5%, and P/B was 0.5x. During these years, the focus of the company was to finance purchase of only Bajaj scooters and bikes.
Then they had a new CEO, and they went from Bajaj focused financing to all in all consumer financing. This when the ROE of Bajaj Finance hit 20%+. As a result, the P/B also climbed to 6x.
You can see, how the changed business model (high growth model) changed the company’s valuation from P/B 0.5x to P/B 12x.
This gain happened from both profit growth and valuation rerating.
How loss-making companies like quick commerce stocks can be evaluated using ROE and P/B method?
We must try to forecast a future ROE.
Let’s take example of Zomato (Eternal).
It’s burning cash now, but if it hits 20% ROE by 2030, you estimate its future P/B and discount it back.
What is the problem (risk) in this type of assumed valuation?
The company is not profitable now, we are assuming that it becomes one in times to come. But I still think that it is better than P/E method. Why? Because assuming an industry average ROE, COE, and growth gives us the basis to assume a fair P/B ratio. But in case of P/E, there is not stndard Profit or EPS numbers.
Conclusion
How to apply this knowledge for stock analysis by oneself?
You can check platforms like Stock Engine and get a historical ROE and P/B data.
Look for companies with strong ROE but temporarily low P/B. Those are our bargains.
Anup also shares a great personal story. He talked about teaching his nieces to invest Rs.1,000 monthly. It’s like planting tree early in life (building a stock portfolio) and then watering it with good stock. The next step is to let compounding do the magic.
I loved his analogy of investing being like a permanent MBA program. You learn from CEOs, question their strategies, and grow your wealth. But it takes time.
Five years, Anup says, is when returns outshine risks.
I hope you like the math behind ROE and P/B that explains how stock valuation can be done.
A 15% ROE typically means a 3x P/B. But a P/B below 2 signals a bargain (if you believe ROE will recover). It is useless to invest in a company that is not going to see ROE expansion no matter how low its P/E is currently.
P/B’s stability makes it a better bet than P/E.
Tell me in the comment section below how you liked this blog post.
Have a happy investing.