Introduction
Every few years, FIIs go through a phase of heavy selling in India.
It happened in 2008. It happened in 2013 and 2016. It happened dramatically during COVID in 2020. And it has happened again through 2025 and into 2026.
Each time the market falls, a lot of investors start doubting whether they should stay invested at all or not.
But here is something I have noticed over the years.
Not all stocks fall equally during these FII selloff phases.
- Some stocks correct 30 to 40 percent and take years to recover.
- Others correct 10 to 15 percent and bounce back quickly.
The difference, almost always, comes down to the quality of the underlying business.
Some businesses are simply built in a way that makes them far less vulnerable to the kind of selling that FIIs do.
In this post, we’ll talk about 7 specific qualities that I look for in a stock when I am trying to build a portfolio that can weather FII selloffs — and still deliver good returns over the long term.
Video

Table of Contents
- Introduction
- Video
- Quality 1: Low FII Concentration in the Shareholding Pattern
- Quality 2: Consistent ROE Above 15%
- Quality 3: Low or Manageable Debt (Debt-to-Equity Ratio Below 0.5)
- Quality 4: Strong Promoter Holding With Zero or Minimal Pledging
- Quality 5: Earnings Consistency — Profit Growth Across Market Cycles
- Quality 6: Pricing Power
- Quality 7: High Free Cash Flow (FCF) Generation
- Checklist: How Investors Can Use These 7 Qualities
- Conclusion
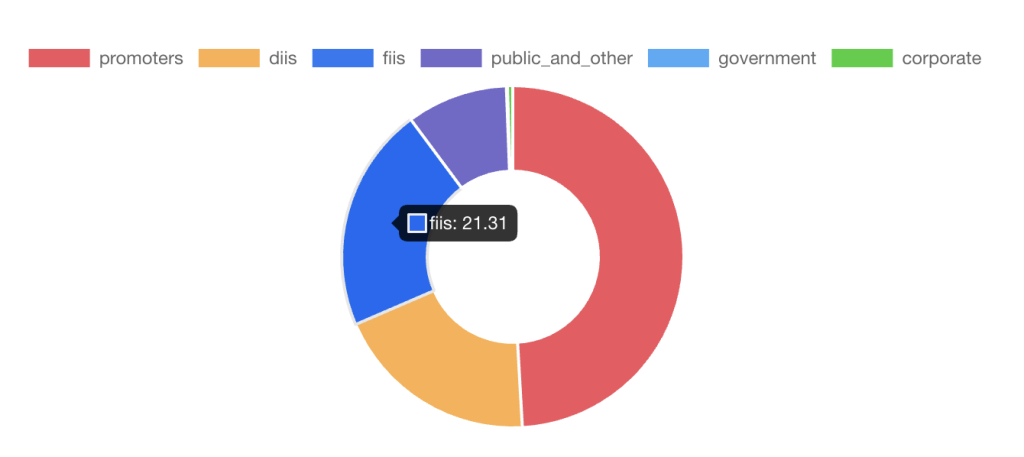
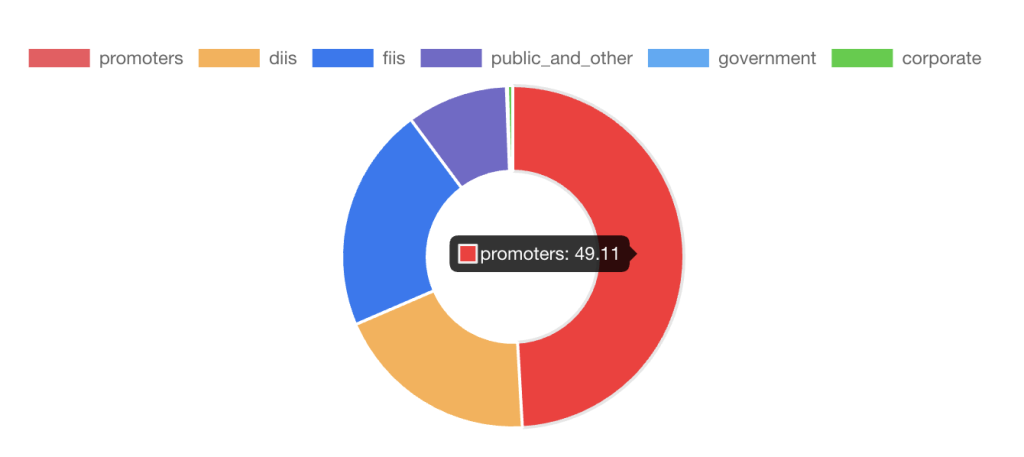
Quality 1: Low FII Concentration in the Shareholding Pattern
If FIIs already hold a very large portion of a company’s shares (say 35%), then when they decide to sell, they have the option of selling in bulk, right?
When there are not many buyers on the other side, such a huge sale will not get bought. In this case, the price falls, sometimes quite sharply.
On the other hand, if FII holding in a company is relatively low (like10%), the selling impact is limited.
Even if every single FII exits at the same time, the quantity of shares hitting the market will be small. It will not be enough that domestic buyers cannot absorb. It will prevent the price from falling considerably.
So when I am evaluating a stock, one of the first things I check is the FII shareholding percentage from the quarterly shareholding pattern filings.
- I look at it over the last 4 to 6 quarters.
- If FII holding is high and has been rising, I know this stock is more vulnerable in an FII selloff environment.
- If FII holding is moderate and stable, the risk is lower.
A number to keep in mind (like a thumb rule): stocks where FII holding is below 15% tend to show significantly less downside during periods of heavy FII outflows.
You can check this data easily on any financial portal like moneycontrol or My Stock Engine. Even the NSE/BSE website under the Shareholding Pattern section of any listed company publishes this data.
Quality 2: Consistent ROE Above 15%
ROE is one of those numbers that tells you a lot about a business.
Simply put, it tells you how much profit a company is generating for every 100 rupees of shareholders’ money invested in the business.
If a company has an ROE of 20%, it means that for every 100 rupees you invested as a shareholder, the company generated a net profit of 20% in a financial year.
That is a reasonably efficient use of your capital.
If the ROE is 8%, the company is barely doing better than a bank fixed deposit with all the risks of equity investing. For me, this is not a great deal.
Now, why does ROE matter during FII selloffs specifically?
Because companies with consistently high ROE, say above 15%, for at least 5 to 7 consecutive years, have demonstrated that they know how to generate strong profits from the capital available to them.
They are not dependent on cheap debt or on one-time windfall gains to look good.
Their profitability is structural, meaning the profit is getting built from how the business operates.
When FIIs sell, and markets fall, the stocks that recover fastest are typically the ones where the underlying profits engine keeps running smoothly.
High-ROE companies tend to do exactly that. Their profits hold up even in tough economic conditions because they have genuine competitive advantages.
Important:
- Always check ROE over at least 5 years, not just the most recent year.
- A single year of high ROE could be due to a one-time gain or heavy borrowing.
- Sustained high ROE over multiple years is what you want.
- Also, be careful of companies that show high ROE but carry a lot of debt.
- Debt can artificially inflate ROE because it reduces the equity base.
Always cross-check ROE with the debt-to-equity (D/E) ratio, which I will cover next.

Quality 3: Low or Manageable Debt (Debt-to-Equity Ratio Below 0.5)
I’ll say, excess debt is the single biggest destroyer of long-term wealth in stock investing.
I have seen this pattern repeat itself so many times.
A company looks good on the surface. It was growing revenues, posting decent profits, and also had good management. But underneath, it was carrying significant debt.
Even for such companies, when interest rates rise, or when the economy slows down, or when FIIs start selling, and the stock price falls, the company starts to struggle to meet its loan obligations.
The stock price goes into a tailspin.
High debt invariably creates a vicious cycle at some point or another.
- When a company has large debt, it uses a significant portion of its operating profits just to pay the interest on debt. This means less money is available for reinvestment in the business, for paying dividends, or for growth in general.
- Lower profit-growth makes the stock less attractive to investors, which pushes the price down further.
- If borrowing costs go up (say, due to a rise in interest rates), which is exactly the kind of environment in which FIIs often sell, the pressure on these high-debt companies further intensifies.
So how can we investors keep a check?
The Debt-to-Equity (D/E) ratio is the simplest way to measure this. It tells you how much debt a company has for every rupee of shareholders’ equity.
So, what is the thumb rule that I follow to check if the D/E level is acceptable or not?
- For most businesses outside of banks and NBFCs (where debt is actually their raw material), I prefer companies with a D/E ratio below 0.5.
- Debt-free companies, or those with D/E lower than 0.5, are even better.
Low-debt companies have a financial cushion. It allows them to survive and even grow during difficult periods. At times when their over-leveraged competitors struggle, such companies actually benefit during tough times.

- One important exception: banks, NBFCs, and housing finance companies naturally operate with higher debt because they borrow money to lend. For these companies, I look at different metrics like the following instead of the D/E ratio:
- Net NPA ratio,
- Capital Adequacy Ratio, and
- Return on Assets (ROA).
- If you want to know more about how to analyze bank stocks, check this link.
Quality 4: Strong Promoter Holding With Zero or Minimal Pledging
Who are promoters? They are founders or controlling shareholders of a company.
These are people who built the business and are most closely associated, who generally give a long-term direction to the company.
The ownership stake of promoters is a telling signal available to an outside investor.
I follow the logic below to decode the promoter holdings:
- When promoters hold a large portion of the company (50% or more), it tells you that the people who know the business best are still deeply invested in it. They have still not taken their money off the table and are deeply involved as of this date. Their personal wealth is tied directly to how the company performs. This alignment of interest between promoters and shareholders is an important indicator for long-term investors.
- On the other hand, when promoter holding falls steadily over several quarters (especially without any clear explanation), it is worth pausing and asking why. Are they losing confidence in the business? Are they raising funds for personal use by selling shares?
I think these are questions that do not always have alarming answers, but they deserve investigation when promoter holding is falling continuously.
The next part of this quality is pledged promoter shares.
Pledging means the promoter has used their own shares as collateral to take a personal or business loan. I always consider pledging as an indicator of risk; otherwise, why would promoters of a financially healthy company need to pledge their shares to raise capital?
Why do I say it is an indicator of risk?
- If the stock price falls below a certain level, the lender can forcibly sell those pledged shares in the open market to recover their money.
- This creates additional selling pressure at exactly the wrong time, when the market is already falling.
We have seen this play out badly in several Indian companies, particularly in real estate and infrastructure stocks.
SEBI requires companies to disclose pledged promoter shares every quarter.
You can check this on portals like moneycontrol or My Stock Engine.
As a thumb rule, I avoid companies where more than 20 percent of promoter holdings are pledged. Zero pledging is the ideal.
Quality 5: Consistency of Profit Growth Across Market Cycles
This is perhaps the most fundamental quality of all. I personally like this metric a lot.
A company’s stock price, over the long term, follows its net profit (mainly EPS). It may diverge for a few quarters due to market sentiment, FII flows, or global events. But eventually, the market always prices a company based on what it earns.
So the question I always ask is this:
“Does this company grow its profits steadily, year after year, across different economic environments — not just in good times, but also during slowdowns, rate hike cycles, and external shocks?”

A company that grows its earnings at 12%-15% per year consistently, over a 5 to 10 year period, is worth far more than a company that earns spectacularly in one year and then struggles for the next two.
The consistency matters as much as the levels. We must keep this in mind.
When I look at profit (EPS) consistency, I also look at the following metrics in tandem:
- Revenue growth trend over 5 years,
- Net profit margin trend over 5 years, and
- Whether operating profits have grown steadily or with a lot of volatility.
A company with volatile earnings is more vulnerable during FII selloffs.
A company with rock-steady earnings growth can command a premium valuation and falls less in a correction because investors are confident the profits (EPS) will keep coming.
Here are a few practical checks:
- Look at the 5-year revenue CAGR and the 5-year net profit CAGR.
- If revenue is growing at 12% and profits at 15%, that is a healthy picture. Such a company is not just growing the top line but also improving profitability.
- If revenue grows but profits are flat or falling, the company is losing pricing power or control over costs.
We must also check EPS (Earnings Per Share) growth. It will tell us whether the profit growth is actually reaching shareholders or being diluted by constant equity issuances. Read more about equity dilution here.
Quality 6: Pricing Power
It is the ability of the company to raise prices without loosing its customers.
Pricing power is one of those qualities that is hard to measure directly in a financial statement, but its impact shows up clearly in margins over time.
I think it is one of the most important protectors of long-term value. People who have stocks (companies) with pricing power in their portfolio will see consistent compounding for decades.
Allow me to explain the pricing power in a simple way.
- A company that has pricing power can pass on higher costs.
- Whether the higher cost was due to raw material costs, energy costs, or wage increases, such companies can easily pass on the price to their customers. The price hike will not cause a drop in demand.
- Imagine Nestle India increasing the price of Maggie Noodles. Would you stop buying Maggie? No, right? This is what gives pricing power to Nestle India.
- Pricing power means profit margins will stay stable or even improve, even when input costs rise.
Think about what happens in an inflationary environment. It often accompanies FII selloffs.
Companies without pricing power see their margins squeezed. They earn less profit even on the same revenue. As their EPS disappoint, their stocks fall.
Companies with pricing power are able to maintain or grow their margins. Their EPS hold up, and hence their stock is more resilient.
Where does pricing power come from?
Typically from one of a few sources.
- It can come from a very strong brand. Companies like Nestle India or Pidilite have great brand power. Their consumers are so attached to the product that they will pay more rather than switch.
- It can also come from a near-monopoly or duopoly position in an industry. It can come from high switching costs — meaning it is very expensive or inconvenient for a customer to switch to a competitor. Or it can come from proprietary technology or intellectual property. In the Indian listed space, one such example is Airtel.
What is the practical way to check for pricing power?
- Look at operating profit margin (EBITDA margin) trends over 5 to 7 years.
- If the margin has stayed stable or improved over time, the company likely has meaningful pricing power.
- If margins have been shrinking consistently, it is a weak company.
Quality 7: High Free Cash Flow (FCF) Generation
This is the metric that separates companies that look good on paper from companies that are actually financially strong in real life.
Free Cash Flow (FCF) is the actual cash a company generates from its operations after spending what is necessary to maintain and grow the business.
In simple terms, FCF is the money left over after paying all the bills, running the factories, and investing in growth. This is real money (cash) that actually sits in the company’s bank account.
Now, why does FCF matter so much?
Profit reported in the income statement can sometimes be manipulated to display better numbers. For example:
- Receivables can be inflated,
- Depreciation can be adjusted, and
- Inventory can be valued in ways that make profit look higher than it actually is.
But cash flow is much harder to manipulate. Either the money is in the bank, or it is not.
Companies with high and growing free cash flow have enormous advantages.
- They can fund their own growth without constantly raising debt or equity.
- They can pay dividends and buy back shares, both of which directly benefit long-term shareholders.
- They can survive recessions and downturns without needing emergency capital.
- During FII selloffs, when stock prices fall, these companies can sometimes buy back their own shares at attractive prices, which further benefits remaining shareholders.
Companies with poor free cash flow are perpetually dependent on external financing. One example is those companies that are very capital-intensive, like Steel, Cement, Power, Construction, Capital Goods, Defence, Telecom, etc.
They need to keep raising debt or diluting equity. This is a structural weakness that becomes very visible during periods of stress (like the situation in the 2008 financial crisis, 2020 COVID, war, oil crisis, etc).
If you want to know more about how to calculate free cash flow (FCF), you can read this article.
The main use of FCF is to estimate the Intrinsic Value of stocks (DCF Method). My Stock Engine can calculate the intrinsic value of a stock using multiple valuation models. You can use it to get an idea of how the current price of a stock is positioned as compared to its estimated intrinsic value.

Some businesses, like companies in the consumer goods space, certain IT services companies, and select pharmaceutical businesses, healthcare companies, generate very high free cash flow relative to their earnings. This is one reason why they remain resilient during market corrections.
Checklist: How Investors Can Use These 7 Qualities
Let me now show you how to use all seven qualities together as a practical screening framework.
You do not need every single quality to be perfect. Very few companies in the world score a perfect 10 on everything.
The goal is to find companies where at least 5 of these 7 qualities are clearly present and the remaining 2 are at least neutral (should not appear as a huge concern).
| SL | Quality | What to Check? |
| 1 | Low FII Holding | FII % in latest shareholding pattern. Prefer below 15-20% |
| 2 | High ROE | 5-year average ROE. Prefer consistently above 15% |
| 3 | Low Debt | D/E ratio. Prefer below 0.5 (except banks) |
| 4 | Promoter Quality | Promoter % (prefer 50%+). Pledged shares (prefer near zero) |
| 5 | Net Profit or EPS Consistency | 5-year revenue & profit CAGR. Prefer steady, not lumpy growth |
| 6 | Pricing Power | EBITDA margin trend over 5 years. Prefer stable or improving |
| 7 | Free Cash Flow (FCF) | Check the Intrinsic Value and compare it with the current price. You can also do the calculations and pick the stocks yourself (see here) |
A stock that passes 5 out of these 7 checks is a reasonable candidate for deeper research.
One more thing I want to say.
These qualities do not guarantee that a stock will not fall during an FII selloff. In a broad market correction, almost everything falls to some extent. But companies with these qualities fall less, recover faster, and deliver better compounding returns over the full cycle.
Our goal should be not to avoid all short-term pain, but to emerge stronger in a 5-7 year time horizon.
Conclusion
FII selloffs are uncomfortable and cause a lot of pain in the market; there is no doubt about it
They create fear and doubt. But they also create something very valuable, lower prices for high-quality businesses.
If you have done the work upfront to identify stocks with these 7 qualities, then a selloff is not a crisis. It is a buying opportunity.
I hope this framework helps you think more clearly about your own portfolio.
Have a happy investing.
List of stocks worth being in the FII-Proof Portfolio
| SL | Name | Price (Rs.) | Market Cap | P/E Ratio | FII Holding | FII-Proof Score | My Remarks |
| 1 | TCS | 2384 | 8.65 lakh cr | ~18x | 10.40% | Excellent | FII holding of only 10.4% is among the lowest for any large-cap IT company. With promoters (Tata Sons) holding 71.8%, price stability during FII selloffs is very strong. Despite being in IT — a sector under pressure — TCS scores on nearly every FII-proof quality: zero net debt, consistent 5-year earnings CAGR of 10–12%, ROE of ~52%, and one of the best free cash flow generators in India. After falling ~33% over the past year, TCS is now at a PE of ~18x — its cheapest valuation in nearly 6 years. This is the kind of entry point long-term investors wait for. The stock also carries a dividend yield of ~5.2%, providing income while you wait for recovery. Special Note: TCS announced an ₹18,000 crore share buyback, further supporting shareholder value. |
| 2 | Pidilite Industries | 1336 | 1.41 lakh cr | ~61x | 12.00% | Excellent | Pidilite scores on virtually all 7 qualities. FII holding is just 12%, promoter holding is strong at 69.3% (Parekh family), and pledging is near-zero. The company is best known for Fevicol — one of India’s most iconic and arguably unrivalled brands — along with Dr. Fixit and M-Seal. This is pure pricing power. The company is effectively debt-free, maintains an ROE of ~23%, and has a consistent free cash flow track record. The business is difficult to disrupt, which means earnings are predictable across economic cycles. Yes, the PE of ~61x looks high. But Pidilite has always commanded a premium, and it has historically justified it with earnings consistency. |
| 3 | Nestle India | 1186 | 2.29 lakh cr | ~69x | 9.80% | Excellent | Nestle India has the lowest FII holding on this list — just 9.8% — which makes it one of the most naturally FII-proof large-cap stocks in India. Promoter holds 62.8%, and the remaining float is largely held by domestic institutions and retail investors. The company manufactures Maggi, KitKat, Nescafe, Munch, and Milkmaid — brands so embedded in Indian households that they sell in good times and bad. Nestle India is almost debt-free, generates consistent free cash flow, and pays out nearly all earnings as dividends. The PE of ~69x reflects the quality premium the market assigns to such predictable earnings. This is not a cheap stock, but it rarely is. During every major FII selloff in the past, Nestle India has been among the most resilient large-cap stocks. |
| 4 | HDFC Bank | 744 | 11.45 lakh cr | ~15x | ~19% (declining) | Good | This is the deep-value FII-proof pick. HDFC Bank’s FII holding has declined sharply from a peak of ~27% (post merger with HDFC Ltd in 2023) to ~19% as of early 2026 — and this decline is itself the reason the stock has corrected 30%+ from its highs. But this also means the major FII selling pressure is already largely in the price. HDFC Bank has consistently delivered 15–18% loan book growth, maintains a low Net NPA ratio of ~0.3%, and has an ROA of ~2%. PE of ~15x is at its lowest in over a decade — a level that historically has been an excellent entry point for long-term investors. As FII selling stabilizes and domestic SIP flows continue to absorb supply, this stock has significant re-rating potential. |
| 5 | Bajaj Auto | 9051 | 2.55 lakh cr | ~28x | ~17% | Good | Bajaj Auto is the auto sector’s most FII-proof pick. The promoters hold ~55%, FII holding is moderate at ~17%, and the company is completely debt-free. More importantly, it generates strong free cash flow — the business does not need external capital to grow. Earnings momentum is exceptional: Q3 FY26 net profit grew 18.7% YoY, and total sales in February 2026 were up 27% YoY. The company is also the world’s largest exporter of two and three-wheelers, which diversifies it beyond India. The EV segment (Chetak) is scaling up, and the partnership with Triumph Motorcycles adds a premium angle. Bajaj Auto also has a large cash and investment holding on its books (over Rs. 22,000 crore), which acts as a safety buffer. |
| 6 | HUL | 2052 | 5.07 lakh cr | ~34x | ~15% | Good | HUL is India’s largest FMCG company — Dove, Surf Excel, Lipton, Rin, Lakme — 9 out of 10 Indian households use at least one HUL product every day. With promoters holding ~62% and FII holding at a moderate ~15%, the stock’s price stability during FII selloffs is well above average. HUL is nearly debt-free, maintains a healthy EBITDA margin of 24–25%, and has paid consistent dividends for decades. The stock has corrected significantly over the past year, bringing the PE down to ~34x, which is at the lower end of its 5-year historical range. Volume growth recovery in FMCG is expected to be a key theme in FY27 as rural demand improves — and HUL, with its deep rural distribution, will be a direct beneficiary. |
| 7 | ITC Ltd (Contrarian View) | 290 | 3.64 lakh cr | ~10x | 36.1% ⚠️ High | Special Case | IMPORTANT CAVEAT: ITC has a HIGH FII holding of 36.1% — which means it does NOT pass Quality #1 (low FII concentration). So why is it on this list? Because despite the FII risk, ITC is unique in several ways that make it worth watching for contrarian long-term investors. ITC is trading at just 10x earnings — its cheapest valuation in over a decade. It generates extraordinary free cash flow from its cigarettes business (~₹18,000+ crore per year). The company has zero debt, a consistent dividend track record, and is actively diversifying into FMCG, Hotels, and Agribusiness. In the current FII-selling environment, ITC has already borne significant selling pressure — which is partly why the stock has fallen ~35% from its highs. At this valuation, domestic investors and DIIs have become strong accumulators. |
Disclaimer: This content is for knowledge shareing purpose only. Do not take anything as investment advice. Do your own research or take professional help before investing.


![India's Food and Beverage (F&B) Sector Analysis [2025] - Thumbnail](https://getmoneyrich.com/wp-content/uploads/2025/01/Indias-Food-and-Beverage-FB-Sector-Analysis-2025-Thumbnail-300x180.jpg)