Q: I’m really confused about why the Russian Ruble has been so shaky since 2020, especially after COVID hit and the Russia-Ukraine war started.
I’m curious know to know what caused this big change in the Ruble’s value?
How does this affect daily life there, and could it impact us in India?
I want to understand if other global events play a role and whether the Ruble’s situation might improve or worsen in the future.
Answer:
Back in early 2020, before COVID-19 turned the world upside down, the Ruble was anyways not performing so well. Just for your context, in a period between 2010 and 2020, when USD/INR depreciated by 1.55 times, USD/RUB depreciated by 2.13 times.
| Currency | Year Jan’2010 | Year Jan’2020 | Note |
| USD/RUB | 30.0 | 64.0 | Depreciated by 2.13x |
| USD/INR | 46.0 | 71.5 | Depreciated by 1.55x |
But after COVID, as all other currencies took a hit, the Russian Rubel also did badly. Take a look at the USD vs Russian Ruble chart since 2020.

You can see it hovering around 66-78 Rubles per Dollar by the starting of 2020.
Russia’s economy relied heavily on oil and gas exports. If Russian exports are steady, it keeps the Rubel steady too.
As an Indian, we can relate this to how our Rupee also depends on global oil prices, when oil prices drop, it hits us too, right?
| Date | Price | Notes |
|---|---|---|
| 01-Feb-20 | 66.88 | |
| 01-Mar-20 | 78.44 | Start of COVID-19 |
| 01-Apr-20 | 74.38 | |
| 01-May-20 | 70.14 | |
| 01-Jun-20 | 71.17 | |
| 01-Jul-20 | 74.41 | |
| 01-Aug-20 | 74.07 | |
| 01-Sep-20 | 77.63 | |
| 01-Oct-20 | 79.53 | |
| 01-Nov-20 | 76.40 | |
| 01-Dec-20 | 74.41 | |
| 01-Jan-21 | 75.74 | |
| 01-Feb-21 | 74.62 | |
| 01-Mar-21 | 75.70 | |
| 01-Apr-21 | 75.21 | |
| 01-May-21 | 73.43 | |
| 01-Jun-21 | 73.15 | |
| 01-Jul-21 | 73.14 | |
| 01-Aug-21 | 73.23 | |
| 01-Sep-21 | 72.75 | |
| 01-Oct-21 | 70.95 | |
| 01-Nov-21 | 74.08 | |
| 01-Dec-21 | 74.65 | |
| 01-Jan-22 | 77.38 | |
| 01-Feb-22 | 94.60 | |
| 01-Mar-22 | 83.20 | Start of Russia-Ukraine War |
| 01-Apr-22 | 70.96 | |
| 01-May-22 | 61.50 | |
| 01-Jun-22 | 51.45 | |
| 01-Jul-22 | 61.62 | |
| 01-Aug-22 | 60.23 | |
| 01-Sep-22 | 58.45 | |
| 01-Oct-22 | 61.48 | |
| 01-Nov-22 | 60.99 | |
| 01-Dec-22 | 69.90 | |
| 01-Jan-23 | 69.82 | |
| 01-Feb-23 | 74.97 | |
| 01-Mar-23 | 77.60 | |
| 01-Apr-23 | 80.25 | |
| 01-May-23 | 81.10 | |
| 01-Jun-23 | 89.55 | |
| 01-Jul-23 | 91.60 | |
| 01-Aug-23 | 96.03 | |
| 01-Sep-23 | 97.97 | |
| 01-Oct-23 | 93.40 | |
| 01-Nov-23 | 89.45 | |
| 01-Dec-23 | 90.36 | |
| 01-Jan-24 | 90.02 | |
| 01-Feb-24 | 91.15 | |
| 01-Mar-24 | 92.48 | |
| 01-Apr-24 | 93.05 | |
| 01-May-24 | 90.10 | |
| 01-Jun-24 | 85.53 | |
| 01-Jul-24 | 86.00 | |
| 01-Aug-24 | 90.65 | |
| 01-Sep-24 | 93.00 | |
| 01-Oct-24 | 97.37 | |
| 01-Nov-24 | 106.50 | |
| 01-Dec-24 | 113.50 | |
| 01-Jan-25 | 98.58 | |
| 01-Feb-25 | 89.38 | |
| 01-Mar-25 | 83.00 | |
| 01-Apr-25 | 82.00 | |
| 01-May-25 | 77.50 | |
| 01-Jun-25 | 78.20 | |
| 01-Jul-25 | 81.10 | |
| 01-Aug-25 | 79.90 | |
| 01-Sep-25 | 84.01 |
The COVID-19 Shock
When the pandemic hit in March 2020, oil prices crashed by about 70% in just two months.
This was a big blow for Russia, since oil and gas make up nearly half its exports. The Ruble took a hit, dropping from 63.6 to 77.7 Rubles per Dollar by late March.
It’s was the same time when our stock market shook due to the announcement of lockdowns. The business slowed, and currencies felt the pressure as an after effect.
But Russia managed to stabilize things somewhat with government intervention, and the Ruble recovered a bit as oil prices picked up later that year.
The Russia-Ukraine War
Fast forward to February 2022, when Russia invaded Ukraine. That’s when the Ruble really took a nosedive.
Within days, it lost almost 50% of its value, hitting a low of 150 Rubles per Dollar. The above chart shows this sharp spike clearly. Why?
Western countries slapped heavy sanctions on Russia, freezing its central bank assets, cutting off major banks from global finance, and even capping oil prices. It was a huge hit on the Russia’s economy.
Initially, the Ruble crashed, but Russia fought back with high interest rates (up to 20%) and forced exporters to convert foreign earnings into Rubles.
By mid-2022, it climbed back to around 80 Rubles per Dollar, thanks to booming oil sales to countries like China and India. Had this not been the case, both Russian Economy and Global oil prices would have been in shambles.
Ongoing Struggles of the Russian Ruble
Since then, the Ruble hasn’t found peace.
By late 2024, it dipped again to 114-115 Rubles per Dollar due to new sanctions, falling oil prices, and Russia’s war spending.
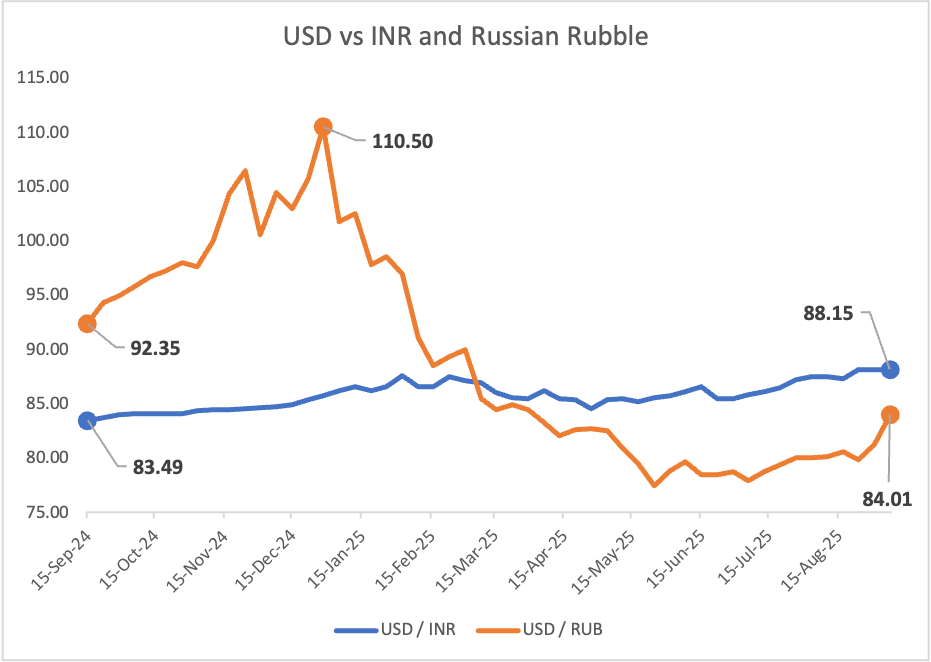
The USD-INR-RUB chart shows how the Indian Rupee has been more stable, rising steadily from 83.49 to 88.15 against the Dollar, while the Ruble fluctuated wildly from 92.35 to 110.50 in the same period.
Russia’s trade surplus shrank as Europe cut imports, but India and China stepped in, buying discounted oil. Still, with lower export revenues and a budget deficit, the Ruble remains volatile.
As an Indian, we must notice how our oil imports from Russia grew, helping us save money but also tying us to this instability (volatile Ruble).
How Does This Affect Daily Life in Russia?
A weaker Ruble means higher prices for imports. Items like food, electronics, and medicines’ prices surge doe to weak Ruble.
Inflation has soared, hitting 8.5% in 2024, double the target rate. Russians are feeling it at the grocery store and in their wallets.
The government’s doubled defense spending (nearly 30% of the budget) also means less for healthcare or infrastructure.
It’s a bit like how rising prices hit us during global crises, but for Russia, it’s amplified by war costs and sanctions.
Global Connections and India’s Role
This isn’t just Russia’s problem.
The war disrupted global wheat and energy supplies, pushing up prices worldwide. We have felth its impact in India too.
Russia’s shift to selling oil to Asia, including us, has kept its economy afloat but at discounted rates.
A volatile Ruble also makes trade trickier, affecting global markets we’re part of.
Our Rupee’s stability compared to the Ruble shows how diversified our economy is, but we’re not immune to these ripples.
What’s Next? Will It Get Better or Worse?
Predicting the future is tough because of way the relationship between Ukraine and Russia has deteriorated in the last couple of years.
The Ruble’s fate hinges on oil prices, sanctions, and the war’s end.
If oil stays low or sanctions tighten (like the recent Gazprombank hit), the Ruble could weaken further. Russia’s central bank might raise interest rates again (it’s already at 21%) to control inflation, but that could slow growth. It can also lead to stagflation. It is a mix of rising prices and stalled progress.
Peace talks or a shift in global politics might help, but with the war ongoing and new alliances forming, uncertainty looms.
For us in India, keeping an eye on oil deals with Russia will be key.
Conclusion
The Ruble’s volatility since 2020 stems from COVID’s oil price crash, the Russia-Ukraine war’s sanctions, and ongoing economic pressures.
To highlight how disturbed the Ruble has been since 2020, I’ve provided two charts for your perspective. The first chart highlight how Ruble has been effected post 2020 pandemic till today (September 2025). The second chart highlight the volatility of Ruble compared to the Indian Rupee.
Our Indian Rupee has also seen its fare share of problems in since 2024. But when you compare our INR with RUB, INR looks surprisingly stable.
It’s a tough spot for Russia, with global echoes we feel too.
If you have got more questions, drop them below, I’ll try to answer them for you.