Introduction
When I began narrowing down my stock research process, I noticed that most fundamentally weak companies could be eliminated using just a few financial indicators. However, the challenge was not the availability of information; it was deciding which numbers actually mattered first.
When the task is to screen all 5,000 listed stocks of the market, and you know that 90% of them are junk companies, picking the right metrics becomes critical.
I wanted to look at the annual reports of companies like KPIT Technologies, Ratnamani Metals, etc. But without a framework, it felt inefficient. I would take us weeks just to read the annual reports of a handful of companies.
When I started to practice fundamental analysis, there was a lot of clutter. The data was not cluttered, and my thought process was not streamlined. It was not easy to find one perfect stock for investing. For example:
- Some businesses showed strong revenue growth, but their returns were mediocre.
- Others were profitable, but their balance sheets used to carry too much risk. Moreover, in most cases, the risks were not even obvious at first glance.
But over time, with practice, it started becoming easier.
I settled on three financial filters that consistently helped me separate strong businesses from average ones:
- ROCE,
- Debt levels, and
- Growth trends.
In this post, I’ll will be testing this framework across companies like Cera Sanitaryware, Vinati Organics, Sonata Software, and APL Apollo Tubes. I’ll do it to reinforce the practical usefulness of my three (3) financial filters.
[Note: I’ve randomly selected these companies just for analysis sake for this post. There is no specific reason or preference in these picks.
Why I Use a Screening Framework Before Deep Research
As I said before, in the stock market, there is no shortage of companies to analyze. But the real problem is deciding where to start.
If I randomly pick companies and begin reading annual reports, I often, in the past, used to end up spending time on businesses that are financially average or inconsistent.
At the end of the day, I used to feel that my whole day has gone waste. I got nothing out of it.
I learned this the hard way.
Earlier, I would get interested in a company just because revenue was growing or the stock price had performed well. But after digging deeper, I would sometimes discover weak capital efficiency or unnecessary debt. These are a few things I could have identified in minutes if I had checked a few key numbers first.
Let’s take KPIT Technologies and APL Apollo Tubes as simple examples.
Both are sizeable businesses with thousands of crores in revenue. At a glance, they may look equally worth researching. But once I check their “ROCE, debt levels, and growth consistency”, the financial character of each business becomes much clearer.
I used to do it for all companies before I went digging into their annual reports.
[Note: These days, I’ve made stock screening easier, and more versatile, by adding the Big Screener to my Stock Engine.]
The framework helps me quickly understand what kind of business I am dealing with before I invest more time studying it.
That is why I think of the screening process as a necessary time management tool for all long-term investors.
Just as we allocate money carefully, we should also allocate our research effort carefully.
A simple filter ensures that deeper analysis is reserved for businesses that already show signs of financial strength.
Let me explain my understanding of how I use my three filters to screen quality companies beforehand.
Filter 1: ROCE — Identifying Efficient Businesses
ROCE is usually the first number I examine because it quickly reveals how efficiently management converts capital into operating profit. You can read more about the basics of ROCE here.
For example, KPIT Technologies provides a strong example of improving capital efficiency. Its ROCE increased from 13.17% in FY21 to 35.39% in FY25. In the same period, its revenue nearly tripled from about Rs. 2,051 crore to Rs. 6,009 crore.

| KPIT Tech (Rs. Crore) | Mar-21 | Mar-22 | Mar-23 | Mar-24 | Mar-25 |
| ROCE % | 13.17 | 22.33 | 23.59 | 32.22 | 35.39 |
| Total Revenue | 2,051.50 | 2,477.20 | 3,405.23 | 4,931.81 | 6,009.67 |
That combination of rising returns and expanding revenue is difficult to ignore for any long-term investor.
Cera Sanitaryware, on the other hand, shows what steady efficiency looks like. Its ROCE has remained consistently around 20–23% over five years. This is a strong indication of a stable and well-managed consumer business rather than a rapidly changing one.
Even in a manufacturing-type industry, ROCE can highlight business quality. Ratnamani Metals maintained ROCE mostly between 18% and 25%. This also suggests operational discipline despite its demand being very cyclical.
Contrast this with Vinati Organics, where ROCE fluctuated from 26.46% in FY23 to around 18% in FY25. It is a strong reminder to us that even strong businesses can see return compression during investment cycles.

Looking across these companies, ROCE quickly helps distinguish consistently efficient businesses from those showing temporary profitability.
How do I do it today?
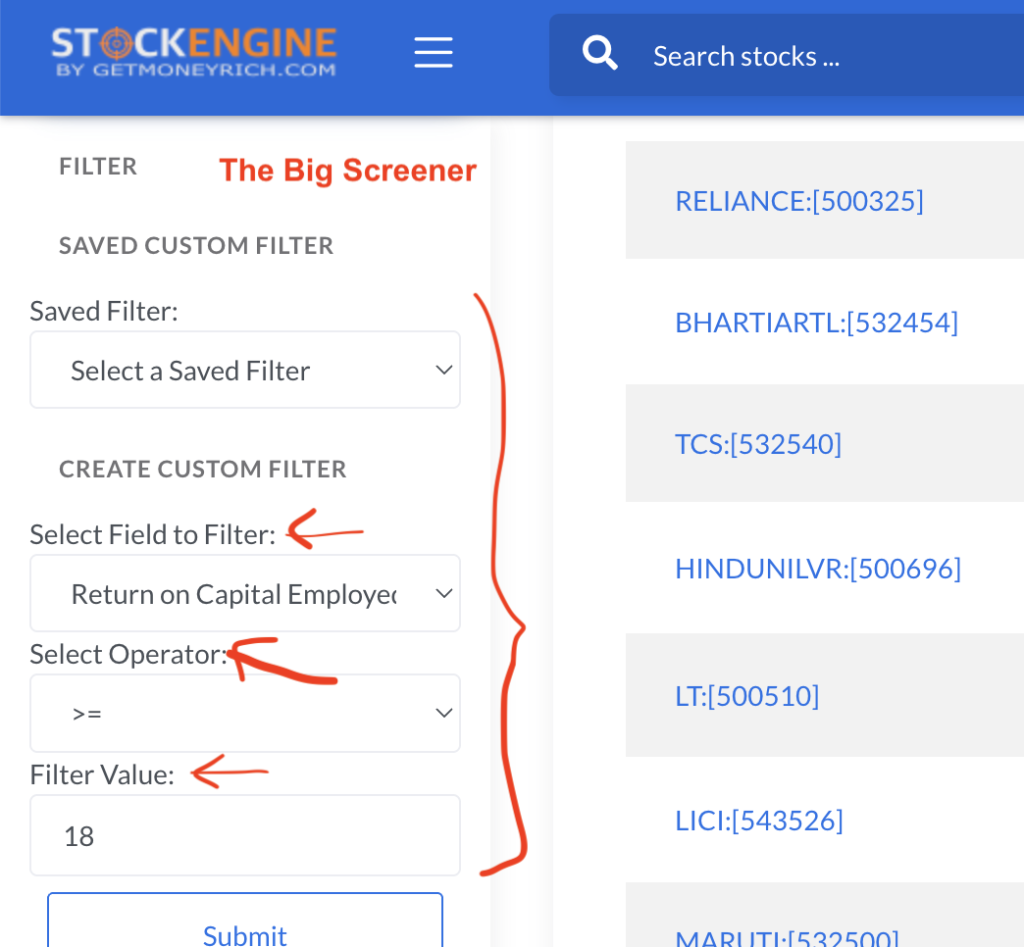
I use the Big Screener of my Stock Engine app. This is how I navigate to perform the stock screening:
- Stock Screener > Big Screener >
- Left Sidebar > Select Field To Filter >
- Pick From Drop Down Menu > ROCE
- Select Operator > more than or equal to (>=)
- Add a filter value (say >18%)
- Select Operator > more than or equal to (>=)
- Pick From Drop Down Menu > ROCE
- Left Sidebar > Select Field To Filter >
You will only need to do this operation once because in the Big Screener, you can also save your built screens. Next time, you can just navigate to the saved screens and get the desired output.
[Note: Same steps can be followed for debt and growth filters as well]
Filter 2: Debt — Avoiding Balance-Sheet Risk
After I’m done analyzing capital efficiency, I look at the leverage used by the business.
I believe that Debt rarely creates value on its own, but it can amplify problems quickly. So it is extremely essential for me to invest in debt-prudent companies only.
Some companies (within my example) demonstrate exceptionally conservative balance sheets.
- Vinati Organics, for example, has operated almost debt-free for years. Its total borrowing is just Rs. 62 crore against equity of nearly Rs. 2,800 crore in FY25. This is resulting in a D/E ratio of about 0.02.
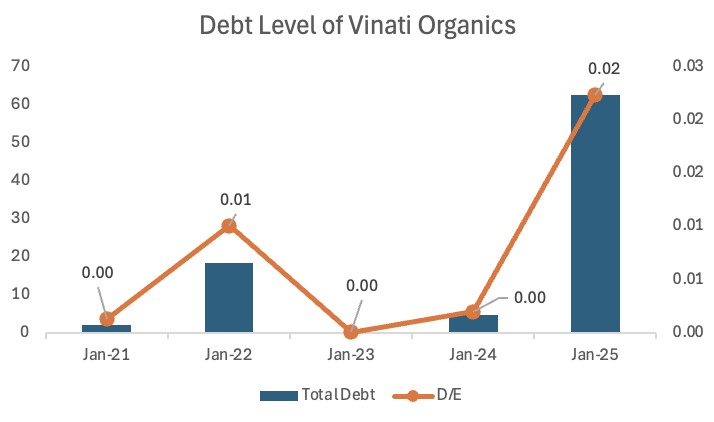
| Vinati Org | Mar-21 | Mar-22 | Mar-23 | Mar-24 | Mar-25 |
| Total Debt (Rs. Cr) | 2.02 | 18.4 | 0.2 | 4.65 | 62.63 |
| D/E Ratio | 0.00 | 0.01 | 0.00 | 0.00 | 0.02 |
KPIT Technologies and Cera Sanitaryware show similar balance-sheet strength, with borrowing levels close to negligible relative to equity.
This kind of financial flexibility reduces the downside risks of companies during slowdowns. Such debt levels are also good from the investor’s perspective as their “interest” expense is nearly zero.
In contrast, Sonata Software illustrates how leverage can change the risk profile of an otherwise strong business. Its total borrowing rose to Rs. 674 crore in FY24, with the debt-to-equity ratio reaching 0.48, before declining again in FY25.
The business remained profitable, but the balance sheet temporarily became more leveraged than I typically prefer.
APL Apollo Tubes provides a useful example of moderate leverage (balanced debt) in a capital-intensive industry. Its total borrowing of Rs. 614 crore in FY25 against equity of over Rs. 4,200 crore results in a manageable D/E ratio of 0.15. This company is not risk-free, but considering the nature of its business (manufacturing), I think its leverage exposure is reasonable.
| D/E Ratio | Mar-21 | Mar-22 | Mar-23 | Mar-24 | Mar-25 |
| KPIT | 0.00 | 0.00 | 0.03 | 0.02 | 0.00 |
| Cera | 0.06 | 0.03 | 0.02 | 0.02 | 0.01 |
| Sonata | 0.10 | 0.03 | 0.38 | 0.48 | 0.26 |
| APL Apollo | 0.26 | 0.26 | 0.29 | 0.31 | 0.15 |
Looking at debt levels reminds me that a company’s ability to survive in difficult periods depends largely on the strength of its balance sheet. We often give too much importance to profits and profitability. But we must understand that profits can fluctuate from one cycle to another. But excessive borrowing can put intense pressure on cash flows when the business is not doing well. It can even lead to bankruptcy.
That is why I prefer businesses where growth is supported by financial stability (low debt), which can keep the company sailingeven in the worst of times.
Filter 3: Growth Which Confirms Business Momentum
To identify a quality company, efficiency (high ROCE) and safety (low debt) alone are not enough. For long term investors, the business must also show growth
Among our example companies, KPIT Technologies stands out for consistent expansion.
- Revenue grew from roughly Rs. 2,051 crore in FY21 to Rs. 6,009 crore in FY25.
- The net profit increased from Rs. 147 crore to Rs. 836 crore.
- This kind of steady scaling reinforces the ROCE improvement already observed.
| KPIT Tech (Rs. Crore) | Mar-21 | Mar-22 | Mar-23 | Mar-24 | Mar-25 | Growth (CAGR) % |
| ROCE % | 13.17 | 22.33 | 23.59 | 32.22 | 35.39 | 21.9% |
| Total Revenue | 2,051.50 | 2,477.20 | 3,405.23 | 4,931.81 | 6,009.67 | 24.0% |
| Net Profit | 147.10 | 276.05 | 384.47 | 599.05 | 836.80 | 41.6% |
Similarly, it is easy to identify growth trends in other example stocks:
- Sonata Software also demonstrates strong revenue expansion. It rose from about Rs. 4,256 crore to Rs. 10,228 crore over five years. This is a CAGR of 19.2% per annum. However, profit growth has been less linear and slower at the same time. In the same period, PAT growth was 11.7% per annum. It shows why growth must be evaluated alongside ROCE and leverage because full revenue growth may not translate into profits as well.
- Cera Sanitaryware represents a different growth profile. It is slower but stable. Revenue increased from Rs. 1,249 crore to Rs. 1,986 crore over five years at a rate of 9.7% per annum. But profits have grown much faster at about 20% CAGR in five years. This is typical of mature consumer businesses.
- APL Apollo Tubes shows cyclical growth characteristics. Revenue expanded significantly between FY21 and FY23 at 19% per annum, but profit declined after FY23 despite continued revenue expansion. That dissimilarity between revenue and profit growth is something I pay more attention to during screening. Unlike other investors, I like investing in cyclical businesses, but I do it during their down-cycles.
| Company | Mar-21 | Mar-22 | Mar-23 | Mar-24 | Mar-25 | Growth (CAGR) % |
| Sonata (Revenue) | 4,255.83 | 5,655.35 | 7,519.94 | 8,738.61 | 10,228.40 | 19.2% |
| Sonata (PAT) | 243.96 | 376.43 | 451.90 | 308.50 | 424.67 | 11.7% |
| Cera (Revenue) | 1,249.49 | 1,469.48 | 1,839.07 | 1,938.92 | 1,986.67 | 9.7% |
| Cera (PAT) | 99.91 | 152.94 | 211.05 | 241.32 | 248.71 | 20.0% |
| APL Apollo (Revenue) | 6,052.07 | 9,097.42 | 14,321.20 | 13,915.48 | 14,440.25 | 19.0% |
| APL Apollo (PAT) | 153.78 | 287.13 | 511.92 | 453.71 | 335.59 | 16.9% |
Within this framework, growth helps me understand whether a company is genuinely expanding its business or simply continuing at the same scale year after year.
Rising revenue and profits usually indicate increasing demand, better execution, or the ability to scale operations over time.
When growth is consistent alongside healthy ROCE and manageable debt, it strengthens my confidence that the business has the potential to compound over the long term.
How the Three Filters Work Together in Practice
Looking across our six example companies will make the framework clearer for us:
- KPIT Technologies scores strongly across all three filters. It shows high ROCE, negligible debt, and consistent growth. This type of company becomes my obvious candidate for deeper research.
| KPIT Tech | Mar-21 | Mar-22 | Mar-23 | Mar-24 | Mar-25 | Growth (CAGR) % | Remark |
| ROCE % | 13.17 | 22.33 | 23.59 | 32.22 | 35.39 | 21.9% | Excellent |
| D/E Ratio | 0.00 | 0.00 | 0.03 | 0.02 | 0.00 | -23.4% | Very Good |
- Cera Sanitaryware combines steady ROCE with minimal leverage and predictable growth, representing a stable compounding-type business.
| Cera | Mar-21 | Mar-22 | Mar-23 | Mar-24 | Mar-25 | Growth (CAGR) % | Remark |
| ROCE % | 14.29 | 19.66 | 23.06 | 22.26 | 21.43 | 8.4% | Very Good |
| D/E Ratio | 0.06 | 0.03 | 0.02 | 0.02 | 0.01 | -25.5% | Good |
Vinati Organics demonstrates a strong balance sheet. Its historical returns are also strong. But the recent ROCE moderation is telling me to double-check how the company is deploying its employed capital.
| Vinati Org | Mar-21 | Mar-22 | Mar-23 | Mar-24 | Mar-25 | Growth (CAGR) % | Remarks |
| ROCE % | 20.61 | 23.38 | 26.46 | 16.61 | 18.09 | -2.6% | Slight ROCE contraction is OK |
| D/E Ratio | 0.00 | 0.01 | 0.00 | 0.00 | 0.02 | 76.5% | Good |
Ratnamani Metals shows healthy ROCE and manageable leverage. But this company displays a cyclical profit behavior. When such companies come to my notice, it changes how I would evaluate them further.
| Ratnamani Metals | Mar-21 | Mar-22 | Mar-23 | Mar-24 | Mar-25 | Growth (CAGR) % | Remarks |
| ROCE % | 17.64 | 18.87 | 24.82 | 25.52 | 19.83 | 2.4% | Stable ROCE is Good |
| D/E Ratio | 0.07 | 0.07 | 0.09 | 0.05 | 0.04 | -12.1% | Low Debt is Good |
| Revenue | 2,341 | 3,176 | 4,507 | 5,132 | 5,246 | 17.5% | Stable Growth |
| Net Profit | 276.00 | 322.64 | 512.28 | 625.10 | 541.57 | 14.4% | Profit is not as stable as Revenue |
Sonata Software highlights how leverage trends can temporarily alter the investment profile of an otherwise growing company.
| Sonata | Mar-21 | Mar-22 | Mar-23 | Mar-24 | Mar-25 | Growth (CAGR) % | Remarks |
| ROCE % | 36.47 | 40.97 | 28.07 | 35.07 | 30.12 | -3.8% | High but falling ROCE |
| D/E Ratio | 0.10 | 0.03 | 0.38 | 0.48 | 0.26 | 21.2% | Increasing Debt |
| Net Profit | 243.96 | 376.43 | 451.90 | 308.50 | 424.67 | 11.7% | Growing but volatile profits |
APL Apollo Tubes illustrates how capital-intensive businesses can still pass the framework if leverage remains controlled and ROCE stays healthy.
| APL Apollo | Mar-21 | Mar-22 | Mar-23 | Mar-24 | Mar-25 | Growth (CAGR) % | Remarks |
| ROCE % | 27.55 | 29 | 25.34 | 23.25 | 22.02 | -4.4% | Falling ROCE |
| D/E Ratio | 0.26 | 0.26 | 0.29 | 0.31 | 0.15 | -10.9% | More debt dependent, But debt is falling |
| Net Profit | 153.78 | 287.13 | 511.92 | 453.71 | 335.59 | 16.9% | Growing but very volatile profits |
Most of the above-listed companies are such businesses that I will take up for deeper analysis. The following traits are common to all of the above stocks.
- High ROCE
- Low or reasonable debt
- Growth rate is high or fair
It is important to note that the applied screening framework does not produce identical businesses. But out of all 5000 stocks that we have in the market, it will give us a list of about 20/30 credible ones for further analysis.
Conclusion
The market can constantly present new ideas, stories, and opportunities to us.
But not all of them deserve equal attention, at least this is what I’ve understood after more than 1.5 decades in the stock market.
This is why I’ve built this simple financial framework. It helps me to stay grounded. It allows me to focus on business reality rather than market excitemen generated by false narratives of Youtube videos and Business News channels. Though I must admit that some influencers and TV channels are more reliable.
ROCE, debt, and growth together create a lens for me through which companies begin to look clearer. They may not necessarily look more attractive, but their numbers sounds more understandable to me.
Using these filters I’m actually asking whether the underlying business is strong enough to endure cycles, deploy capital efficiently, and expand over time.
This shift in perspective has quietly improved how I approach investing.
Have a happy investing