
Looking Beyond High ROE: Separating Business Quality from Leverage

Introduction
Like the P/E ratio, Return on Equity (ROE) is another widely used metric for stock analysis. If you examine the ROE Formula, it consists of two components: Net Profit (PAT) and Shareholders’ Equity. Generally, a high ROE is looked at as high PAT generated for every Rupee of the shareholders’ funds. Hence, a high ROE often becomes our shorthand for a “great business.”
This logic is not wrong. When a company generates more profits from the capital that shareholders have invested, it is likely a good business.
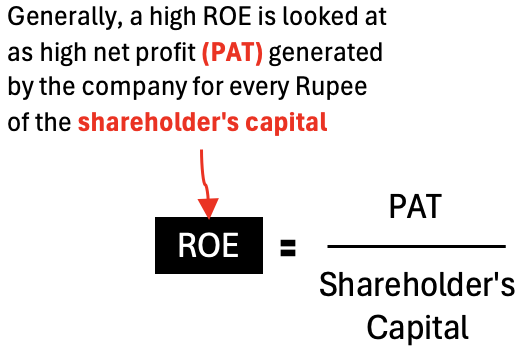
The ROE formula is simple, and this is the reason why people also draw such simple conclusions. High ROE means good business, and low ROE means bad.
I think having such a simplified ROE formula is also its biggest weakness.
When this formula is used in isolation, as a ratio between PAT and shareholders’ capital, a high ROE will only tell us how high the returns are. But it will not tell us where these returns are coming from.
This is what I mean by ‘looking beyond ROE.’ By this, I do not mean to devalue the importance of ROE as a return metric. ROE in itself is an extremely powerful tool, but we must refine how we use it.
The problem is not with the ROE but with how we use it. When we treat a single number, like ROE, as a conclusion instead of a starting point. A high ROE can definitely mean a genuinely superior business, but every time this conclusion is not true.
A high ROE can also be the result of using a lot of debt or running the business in a way that makes the equity base look small.
Without digging deeper into the ROE, those differences will remain invisible to us.
Why High ROE Alone Is Incomplete
Just for example, consider that there are two companies with identical ROE of 25%. On the surface, both companies will look identical, right?
But consider this:
- One Company: This company is able to report a 25% ROE through strong operating margins, efficient use of assets, and steady cash flows.
- Other Company: This company is reporting the same 25% ROE by piling on debt and artificially keeoung its equity base low.
Would you really value these two businesses the same way?
If we look only at the composite ROE number, we’ll not be able to differentiate between the two.
There are many examples where a “high ROE stock” underperforms during tough economic environments. Some high ROE stock shines steadily for years, and many do not.
This is not the issue of our bad luck that we picked the wrong ROE stock; the problem is our incomplete analysis.
So, what shall we do while analyzing the ROE of a company? We should look beyond high ROE; it will only tell us what the return of the company is, but it will not answer why the ROE is high.
The Three Hidden Drivers Inside ROE
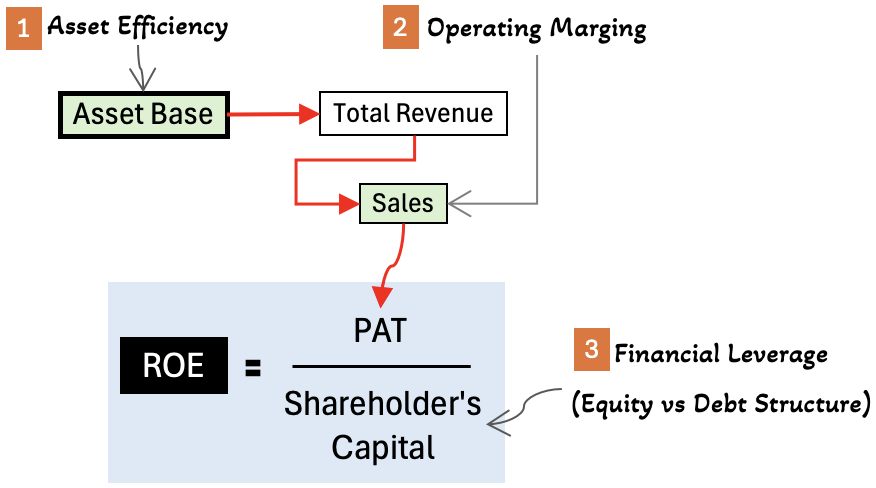
Basically, the ROE of a company is influenced by three broad factors. Out of the three, two are strong indicators of business quality, and one is artificially used to enhance ROE (by using leverage).
- Business Quality:
- Asset Efficiency: When we refer to a company as a business, we actually mean a collection of assets (land, building, machinery, tools, manpower, capital, inventory, brand name, etc). ROE can be enhanced if the same set of assets (business) can generate more revenue. In other words, we can say that the company is enhancing the efficiency of its asset base.
- Operating Margin: ROE of a business can also be enhanced when the company can generate more net profit from the same sales numbers. In other words, we can say that the company is enhancing its operating profitability (margins).
- Leverage:
- Use of Debt: A business can be funded by two sources of capital: equity or debt. During the analysis of a stock, we must know how much of the business is funded by equity and how much is funded using debt. There have been examples where businesses have artificially kept their equity base low (to achieve high ROE), while flooding their balance sheet with an exorbitant debt load.
Each business has its own set of asset efficiencies, operating margins, and leverage multiples.
A very capital-intensive business model will have a lower asset efficiency. Similarly, capital-light models display high asset efficiency.
Note:
As investors, we must also realize that we cannot compare the asset efficiency of a technology company with a company in the cement business. What does it mean? Every industry has its own ideal asset efficiency. To check if a company is asset efficient or not, we must do the comparison within the same industry.
A company that has a high operating margin is primarily due to its brand strength, pricing power, cost discipline, and competitive advantage. Hence, it is often considered as a very strong indicator of business quality.
Some companies use debt to manage their business (growth and operations). Financial leverage, meanwhile, is a financing decision. It can also enhance returns, but it also introduces a degree of risk and cyclicality. It increases fixed obligations like interest payments, which must be met regardless of business conditions. During downturns, profits and cash flows fall, but debt costs remain it is. This can cause the profits to swing more sharply and make the business more vulnerable to economic cycles.
The point is, if we see only the ROE number, we would never realize if that ROE is due to which contributing factor: asset efficiency, operating margin, or financial leverage.
Decomposing ROE into Two Layers
How much of ROE is due to business quality and how much is due to financial engineering?
How to answer this question? To do that, we must learn to decompose ROE into two layers.
A more useful way to look at ROE is to imagine dissecting the total ROE apart (into two layers) rather than accepting it as a single number.
Imagine you ROE as a solid sphere which is made up of two layers – a red core and a blue supporting layer.
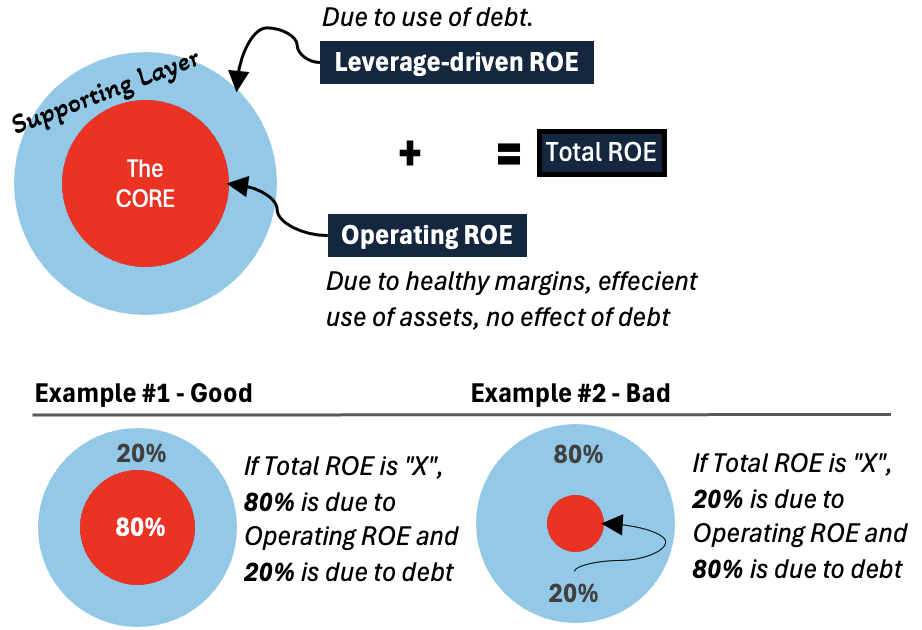
Core Layer (Operating ROE)
The red core represents the return that the business is generating on its own. This return is generated much before the debt starts to do the heavy lifting.
This is what is called Operating ROE. For stock analysts, it is important to find out what out of the total ROE, how much is operating ROE.
The bigger the weight of the Operating ROE (like 80% of the total), the better the business quality. A bigger operating ROE will be due to strong profit margins and efficient use of assets.
Operating ROE is the ROE that the company would report if it had little or no debt in its balance sheets.
Superficial Layer (Leverage-driven ROE)
The blue layer on top of the red core is called the Leverage-driven ROE.
Reasonable use of debt (like D/E ratio below 0.3 or Interest Coverage Ratio (ICR) > 10x), gives an extra boost to the company’s ROE.
But when debt is used aggressively to run and grow a business, in such cases, the weight of Leverage-driven ROE far exceeds the operating ROE of the company.
Imagine a business that runs with a 3x debt-equity ratio. If such companies display high ROE numbers, it is almost certain that their ROE is less due to their operational efficiencies and more due to leverage (use of debt).
Such ROE numbers look better, but the business itself has not become stronger.
Note:
As an investor (or a stock analyst), if we do ot seperate between these two layers, it is easy to draw the wrong conclusions. For example, a capital-intensive construction company may post a high ROE, but it may be a debt-fuelled ROE. On the contrary, consider a consumer brand that will also deliver the same ROE but with very little leverage.
On paper, both companies look equally good. In reality, one company is far more dependent on debt financing to maintain its ROE. This is what makes it very risky for long-term investors. Their PAT numbers (hence ROE) will dramatically change in tough times.
Sustainability Is the Real Question
What is the problem if the ROE is fuelled by operating efficiency or due to leveraging? Till its ROE is high, investors should not worry, right?
For long-term investors, the most important question is not whether a company has high ROE today. It is whether the ROE is sustainable across cycles or not.
The use of leverage can boost ROE quickly, but on its own, debt cannot create economic value for the company. It can only magnify what already exists.
If the underlying business is already generating only low returns on assets, leverage will merely concentrate the risk. It means debt does not improve a weak business; it only magnifies losses and makes profits and cash flows more fragile during tough times (like higher interest rates, slower volumes, tighter credit, etc). The same leverage that inflated ROE becomes a constraint in such times.
But operating strength behaves differently.
Strong margins and efficient asset use tend to persist, even if growth slows. The main differentiator of such businesses is their ability to generate extra cash in excess of their reinvestment needs. The management of such a business feels that ROE is more in its control.
This is why I feel decomposing ROE is not only an academic exercise for investors (analysts) but an essential step to analyze the quality of business.
How Does the Decomposition of ROE Change How We Read Financial Reports?
Once we start seeing ROE in terms of its 3 drivers, the way we read financial statements also changes. We stop asking, “Is the ROE high or not?“
Instead, we start asking better questions:
- How much of the ROE is built from operations versus leveraging?
- Is asset efficiency improving, or does the business need more assets to generate more revenue?
- Is the high ROE supported by cash flows? Is the PAT getting converted into cash flows or not?
- What will happen to this ROE if the company stops borrowing?
What do you think, answering these questions will lead to better judgment about the business quality and valuation, right?
Decomposition of ROE of Britannia and Adani Ports
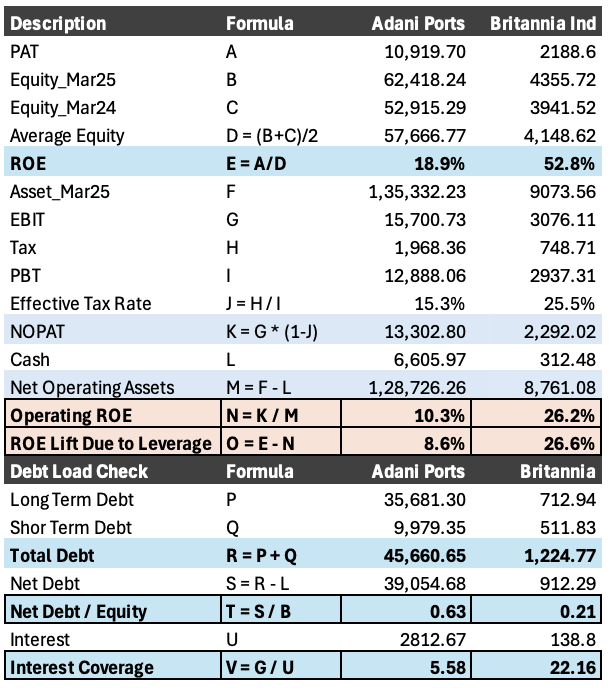
What does the table say?
Total ROE of Adani Ports is 18.9%, out of this, 10.3% is due to Operating ROE, and 8.6% of the ROE lift is due to leverage. For Adani Ports, the Net Debt-To-Equity ratio is 0.63x, and the Interest Coverage ratio (ICR) is 5.58.
Similarly, Britannia’s total ROE is 52.8%; out of this, 26.2% is attributed to the Operating ROE, and 26.6% of the ROE increase is due to leverage. Its Net Debt-To-Equity ratio is 0.21x, and the Interest Coverage ratio (ICR) is 22.16.
Conclusion
At first glance, the ROE decomposition throws a counterintuitive result to us. Why?
Britannia has far lower balance-sheet risk than Adani Ports. Its net debt-to-equity is just 0.21x versus 0.63x of Adani Ports. The interest coverage ratio of Britannia is also 22x as compared to 5.6x for Adani Ports.
Yet almost half of Britannia’s reported ROE comes from leverage.
I thought the core of the ROE (operating ROE) would be much bigger. So I was kind of disappointed seeing the result. But soon, I recognize what “leverage” is actually amplifying in Britannia. A deeper study of these two examples further enhanced my perspective on the decomposed ROE.
In Adani Ports’ case, leverage is compensating for its low operating ROE of 10.3%. Its business runs on a typical capital-intensive model. Such infrastructure-related assets often display low asset turnover. In such cases, debt can meaningfully lift shareholder returns. After debt, the total ROE of Adani Port becomes 18.9%, which is still modest (not high). In such business models, whose operating ROE is low, if leverage is reduced, the total ROE will fall sharply. In a situation when the economy is not doing well, such businesses will see a sharp fall in their ROEs.
Britannia Industry’s situation is fundamentally different. Its operating ROE is already high at ~26%. The company has pricing power, strong brand value, and a capital-light business model. All these factors contribute to this high operating ROE (without debt). In such quality businesses, even small amounts of debt mathematically produce a large ROE lift.
So Britannia’s ROE is superior not because it uses more leverage, but because leverage is amplifying a much stronger underlying business. In contrast, Adani’s ROE depends far more critically on leverage to reach respectable levels.
Special Note
Is it possible to have a negative Leverage ROE? Yes.
I did the calculation for ITC Ltd. Its Leveraged ROE is -8.91%. Is it possible?
It is absolutely possible for some companies. In ITC’s case, it actually makes economic sense.
When a company holds very high net cash (cash and investments exceed debt), leverage works in reverse. Excess cash earns low returns, which dilutes overall ROE rather than boosting it. In such situations, the reported ROE can be lower than the operating ROE, resulting in a negative leverage ROE.
ITC is a classic example of this: a strong operating business with high operating returns, but a large surplus cash and investment base that drags reported ROE down.
I think this is not a weakness. If anything, it reflects balance-sheet strength and optionality rather than financial risk. But yes, different investors would conclude it differently.
Have a happy investing.
Please wait for my next article. You can also subscribe to my newsletters and get notifications of a new post right into your inbox.
Download: A list of the Top 50 Stocks with their ROE decomposed into “Operation ROE” and “Leverage ROE.”
