Introduction
Every time a stock falls sharply, say 25 or 30 percent in just a few months, the first thought that crosses most investors’ minds is: “Has this become cheap enough to buy?”
It is a very natural reaction.
But acting on that instinct, without doing the necessary homework, is one of the most common and costly mistakes in stock market investing.
A falling price and an undervalued stock are two completely different things.
- A stock can fall 40 percent and still be overvalued.
- Another stock can barely move and be significantly undervalued.
The price you see on your screen tells you nothing about the value of the business behind that stock. And unless you understand this distinction clearly, you will keep confusing falling price with opportunity.
In this post, I’ll talk about a structured method that I personally use to identify genuinely undervalued stocks in India. You can use this method to build your own screener in Stock Engine. Read more about how to build an online screener here.
My method involves the following steps:
- Screening stocks through five specific filters,
- Calculating the intrinsic value of the business using a technique called the Discounted Cash Flow method, and
- Applying a margin of safety before making any buy decision.

Price and Value Are Not the Same Thing
Let me start with the most foundational idea in value investing.
Every stock has two things attached to it at all times.
| Price (of the Stock) | Value (of the Business) |
| which is the number displayed on your screen, on any business news channel. This number changes every second. It reacts to quarterly results, global market movements, political news, and sometimes, no real reason at all. Price is inherently volatile | Value is different from price. Value is derived from the company’s actual profits and its future growth potential. It does not change every second. In fact, for a well-run, stable business, the value changes very gradually — quarter by quarter, year by year. Value is comparatively more stable. |
If you were to draw a graph with both price and value on the same chart, you would see something very that will tell you a lot about price and value.
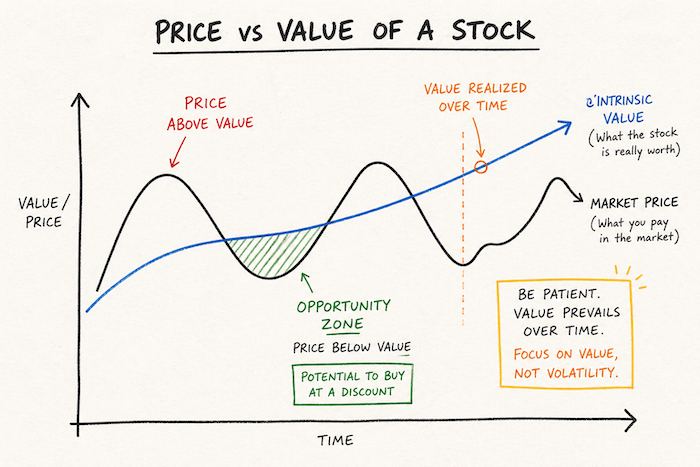
The value line would move in a more or less steady upward direction over time. The price line would look like a sine curve — going up, coming down, going up again, full of volatility.
Sometimes the price would go far above the value. Sometimes it would dip well below it.
That dip, when the price falls below the value of the business, is where the opportunity exists for a long-term investor. This is how wealth has been built by serious investors.
Think about it with a simple example.
Imagine a well-run business with a calculated value of Rs. 150 per share. But due to some temporary bad news, maybe the sector went through a bad quarter, or the broader market fell, the stock is now trading at Rs. 80 per share.
The business has not changed. The profits are intact. The future prospects are the same. Only the price has changed.
In this situation, that stock is undervalued. You are getting Rs. 150 worth of business for just Rs. 80.
But do you know, most will not be able to see this opportunity. Do you know why?
Because they cannot tell the difference between the price and the value. People who know the value of a business are the ones who can locate these opportunities.
Everyone else is just reacting to price movements.
We must keep this distinction in mind:
| Price | Value |
| What’s visible everywhere is the price | The value needs to be calculated. |
What Is Intrinsic Value?
When I say “value of a business,” what I am really talking about is the intrinsic value of the stock.
Intrinsic value is not something you find by looking at the price. You have to calculate it yourself.
This calculation is based on one core principle.
A business is worth the sum of all the future cash it will generate, brought back to today’s terms (present value).
Let me explain this with an example.
Suppose a company generates Rs. 100 crore of free cash flow today. Next year, we estimate it will generate Rs. 112 crore. The year after, Rs. 125 crore. Then Rs. 140 crore, then Rs. 157 crore, and so on for the next 10 years.
If you add all these future cash flows together, you get a large number. But you cannot simply add them up as they are. You need to calculate the present value of those future cash flows.
The money received in the future is not worth the same as money in your hand today.
This is the concept of Time Value of Money, and it is at the heart of intrinsic value calculation.
Think about it from two angles.
- First, as a spender. If inflation is running at 4%, then Rs. 100 in your pocket today will only buy what Rs. 96 buys one year from now. The purchasing power of your money shrinks over time.
- Second, as an investor. If you have Rs. 100 today and you invest it in a fixed deposit at 7%, it becomes Rs. 107 after one year. So your Rs. 100 today is actually worth Rs. 107 of tomorrow. Looking at it the other way, Rs. 107 received one year from now is only worth Rs. 100 today.
This is why, when we calculate intrinsic value, we cannot just add up future cash flows at face value. We have to discount them, convert each future rupee into its equivalent present value.
Once we have done this for all the projected future cash flows and added them all together, what we get is the intrinsic value of the business.
And what is the conclusion?
- If the current stock price is lower than this calculated intrinsic value, the stock is undervalued.
- If the price is higher, the stock is overvalued.
This comparison between price vs. intrinsic value is what guides a serious long-term investor.
The Three-Step Process That I Follow
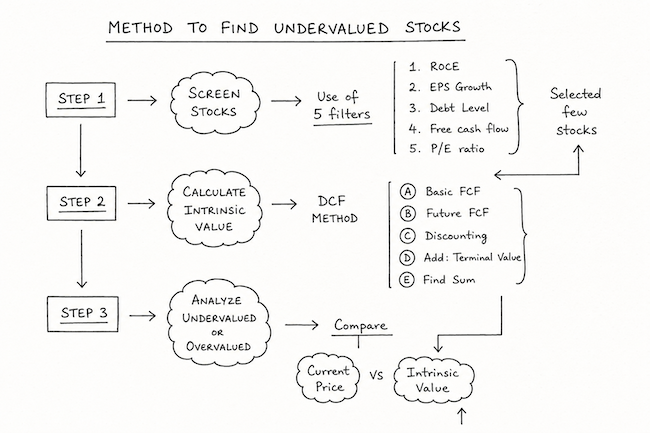
Finding undervalued stocks is not a single-step exercise. Over the years, I have settled into a three-step process that works well for me, and I believe it will work for most serious investors in India too.
- The first step is screening. Out of the 5,000-plus stocks listed on Indian exchanges, I first filter out a small set of fundamentally strong businesses using five specific criteria. This screening step is about finding quality companies (businesses) that are worth analysing in the first place.
- The second step is intrinsic value calculation. Once I have a shortlist of good businesses from the screening step, I calculate their intrinsic value using the DCF (Discounted Cash Flow) method. This gives me a number, a fair price for the business.
- The third step is comparison. I compare the calculated intrinsic value with the current market price. If the stock is trading below its intrinsic value, and by a meaningful margin, that is when I start seriously considering a buy. If not, I put it on a watchlist and wait.
Let me take you through each of these steps in detail.
Step 1 — Screening: The Five Filters
Think of this step like a funnel. You pour all 5,000-plus listed stocks into the top of the funnel.
Inside the funnel, there are five filters.
Only stocks that pass all five filters come out at the bottom.
In my experience, after applying all five filters, you are typically left with around 10 to 15 genuinely high-quality businesses. Those are the only ones I take to the intrinsic value calculation step.
The order in which these filters are applied is important.
I have arranged them in a way that eliminates the weakest candidates first, so I am not wasting time calculating free cash flows for a company that already has a declining EPS or excessive debt.
Filter 1 — Return on Capital Employed (ROCE)
ROCE is, in my view, the single best measure of how efficiently a business uses its capital.
The formula is simple:
ROCE = EBIT (Earnings Before Interest and Tax) / Employed Capital
When I say “employed capital,” I mean the capital that is genuinely being put to work in operations. It is not the cash sitting idle in the bank, nor investments in other companies. The operational capital is what matters here.
Now, why does ROCE matter so much?
Because it tells you how much return the business is generating on every rupee it deploys. And to understand whether that return is good or bad, you need a benchmark.
Here is how I think about it.
- A savings account in India gives roughly 4%.
- A fixed deposit gives around 7%.
- A well-diversified index fund, say, a Nifty 50 index fund, has historically delivered around 12% over the long term.
- A good equity mutual fund can give you 15% or slightly above.
So if a company has a ROCE of 4 or 7%, why would I invest in it? I could get the same return with zero risk from a savings account or an FD.
A company with 12% ROCE is not exciting either. I can just invest in an index fund and match that return without picking individual stocks.
Even 15% is a borderline case for me. A decent mutual fund manager can get me there.
The stocks I am interested in are the ones that have a ROCE consistently above 15%. Ideally, closer to 20 percent or higher.
And the word “consistently” is critical here.
One good year can be luck, or it could be a one-time windfall. But if a company has maintained 18 to 20% ROCE for eight or ten consecutive years, that is telling you something very real about the quality of the business.
My filter: ROCE greater than 15%, sustained over at least five years.
Filter 2 — EPS Growth Rate
EPS stands for Earnings Per Share. It is simply the company’s net profit divided by the total number of shares outstanding in the market.
EPS = Net Profit / Shares Outstanding
If a company earns Rs. 150 crore in net profit and has 15 crore shares, its EPS is Rs. 10 per share.
But I am not interested in a single year’s EPS number. What I want to see is whether the EPS has been growing steadily, year after year.
Here is why EPS growth matters so deeply.
A growing EPS means the business is becoming more profitable every year. And when a business becomes consistently more profitable, two things happen.
- First, its intrinsic value rises every year.
- Second, eventually, maybe not in one month or even one year, but over a longer period, the stock price follows the rising intrinsic value. That is where an investor’s capital appreciation comes from.
The opposite is equally important to understand.
A company whose EPS is falling or stagnating is a company whose intrinsic value is declining. You will often find such stocks trading at low P/E multiples. Many investors get tempted, thinking, “low P/E must mean it is cheap.” But that low P/E is not a bargain. It is a reflection of the fact that experienced investors have already looked at the falling EPS and stepped back.
The market has priced it correctly.
A falling EPS stock that looks cheap by P/E is what is commonly called a value trap. It looks undervalued but is not.
My filter: EPS growth rate of 10% or more per year, maintained consistently.
I do not demand very high growth rates here, because good companies sometimes dilute their shares to raise capital, which can moderate EPS growth. But if the EPS is not growing by at least 10% annually, the stock does not make my list.
Filter 3 — Debt Level
A company with high debt carries a burden that never goes away.
Every quarter, regardless of business performance, the interest payments have to be made.
In good economic times, a highly indebted company might manage. But when business slows down (it happens with every business), that debt can become genuinely dangerous.
Companies with very high debt levels and a bad patch of revenue and profit are the ones that end up in insolvency proceedings.
As an investor, I simply do not want to put my money anywhere near that kind of risk.
The parameter I use is the Debt-to-Equity ratio (D/E).
My personal preference is a D/E ratio of below 0.3. If I have to make an adjustment, maybe the company is in a capital-intensive sector, I might go up to 0.5. But I do not go beyond that.
There is another angle to a high-debt-bearing company.
A highly indebted company spends a significant portion of its operating cash on interest payments. That leaves less cash available for actual business growth. They have less money for expansion, for research, for new products or markets. This directly limits the company’s free cash flow-generating capability.
And low free cash flow, as I will explain in the next filter, leads to a low intrinsic value.
When I say I want a company that is “near debt-free,” I do not mean literally zero debt.
Some amount of working capital debt is normal and manageable. What I mean is a company where, even after accounting for its debt, it has substantial net cash on its books. For example, a company with Rs. 100 crore of debt but Rs. 500 crore of cash in the bank is effectively net-debt free.
Those are the kinds of balance sheets I like.
Filter 4 — Free Cash Flow (FCF)
Free Cash Flow (FCF) is one of the most honest numbers in a company’s financials. And it is that one number that the majority of investors do not know how to find.
The formula of FCF is simple:
FCF = Operating Cash Flow – Capital Expenditure
- Operating Cash Flow is the actual cash the business has collected from its customers after paying its day-to-day operating expenses.
- CapEx is the money the company needs to spend on maintaining and growing its physical infrastructure — machinery, equipment, buildings, and so on. What is left after that CapEx is the free cash flow.
Why is awareness about FCF important?
A company can report a good net profit number (say Rs. 100 crore) in its income statement. But how much of that Rs. 100 crore is actually coming in as real cash? You can bill a client for a service. But whether the client has actually paid, that is a different matter.
Accounting allows companies to recognise revenue before the cash arrives. FCF is immune to this. It only counts actual cash that has come in.
I want to see two things in a company’s free cash flow.
- First, I want it to be consistently positive, not just in one or two years.
- Second, I want it to grow year over year.
A business that is reporting growing profits but has stagnating or negative free cash flow is sending a mixed signal that I take very seriously.
Free cash flow is what funds the following activities of a company:
- Dividends,
- Share buybacks,
- Debt repayment, and
- Future expansion.
A company with strong and growing FCF has real financial health. One with weak FCF, regardless of what the profit and loss statement says, is a business I am not comfortable owning for the long term.
You can find this data in the company’s Annual Report under the Cash Flow Statement.
- Look for “Net Cash Flow from Operations” and “Cash Invested in Property, Plant and Equipment” (or CapEx).
- Subtract the second from the first, and you have the FCF.
Filter 5 — Price-to-Earnings Ratio
This is the filter that most investors start with, but I have deliberately kept it last.
Here is my reason:
P/E is a valuation metric. It only makes sense to check valuation after you have confirmed that the underlying business is strong. If a company has failed on ROCE, EPS growth, debt, or FCF, checking its P/E is a waste of time. The business is not worth owning regardless of price.
But for companies that have passed all four previous filters, the P/E ratio becomes a useful final check.
The formula:
P/E = Stock Price / EPS.
If a stock is trading at Rs. 200 and its EPS is Rs. 10, the P/E is 20x.
This means you are paying Rs. 20 for every Rs. 1 of earnings (Net Profit) the company generates.
Now, the important point, a P/E of 20x means nothing in isolation. You cannot call a stock cheap or expensive just by looking at a single P/E number. You need context. For this perspective, I do three simultaneous comparisons.
- The first comparison is with the company’s own historical P/E. If the same company has traded at an average P/E of 25x over the past five years and is now at 20x, that is a signal that the stock may be cheaper than usual. Remember, it is not a conclusion; it is just a signal.
- The second comparison is with the industry average. If the entire sector is trading at an average P/E of 22x and this particular company is at 20x, that is another data point suggesting relative undervaluation.
- The third comparison is with peer companies. This is often the most revealing. If the closest competitor is trading at 15x, and our stock is at 20x, then our stock is actually more expensive than its peer, and that needs explanation. Maybe there is a very good reason. Maybe not. Either way, this comparison prompts a deeper look.
What would I do in a situation where a peer company shows a lower P/E multiple? Go back and check the peer’s fundamentals: its ROCE, EPS growth, debt, and FCF.
Sometimes you will find that the peer’s lower P/E is fully justified because its fundamentals are weaker.
Other times, you will find that the peer is the more attractive opportunity.
Step 2 — Calculating Intrinsic Value Using the DCF Method
Once a stock has passed all five filters, I move to the intrinsic value calculation.
This is the most involved step, but it is also the most rewarding. Why? Because at the end of it, you have a specific number to compare with the market price.
The method I use is called the Discounted Cash Flow (DCF) method.
It involves five sub-steps.
- Sub-step A(i): Estimate the base free cash flow. Open the company’s most recent Annual Report and go to the Cash Flow Statement. Find the “Net Cash Flow from Operations” figure. Then, under “Cash Flow from Investing Activities,” find the CapEx line. It is usually labelled as “Purchase of Property, Plant and Equipment.” Subtract the CapEx from the operating cash flow. The result is your base FCF. This is your starting point for the entire calculation. Let us say the base FCF comes to Rs. 100 crore.
- Sub-step B(ii): Project future free cash flows for the next 10 years. Now I estimate how this FCF will grow year by year. For the growth rate assumption, I look at the company’s EPS growth rate over the past five years.
- If the EPS has been growing at about 12% annually, I use that same 12% as my growth rate assumption for the first five years.
- For the next five years, I will use a lower rate, say 8%, because it is realistic to expect some slowdown as the company gets larger and its base grows bigger.
So starting from Rs. 100 crore and growing at 12%: Year 1 gives Rs. 112 crore, Year 2 gives Rs. 125 crore, and so on until Year 5.
Then, applying 8% growth from Year 6 to Year 10, I build up the full 10-year projection.
- Sub-step C(iii): Calculate the present value of each year’s projected FCF. This is where the discounting happens. For each year’s projected FCF, I apply the formula:
Present Value = Future Cash Flow / (1 + Discount Rate)^(number of years).
The discount rate I use is 12% for most Indian companies. This represents the minimum return I expect from investing in an individual stock, which should at least match what a good index fund delivers over the long term.
For the Year 1 FCF is Rs. 112 crore. The present value of it is calculated as below:
= Rs. 112 crore / (1+0.12)^(1) = 100
For Year 2, the FCF is Rs. 125 crore. The present value of it is calculated as below:
= Rs. 125 crore / (1+0.12)^2 = 99
Once I have calculated the present value for all 10 years and added them all up, I get a number, let us say Rs. 948 crore. This is the present value of the company’s next 10 years of free cash flows.
PV of 10 Years of FCF = Rs. 948 Crore ……..(1)
[This is still not the intrinsic value of the company. Take the next step]
- Sub-step D(iv): Calculate the Terminal Value. The company does not cease to exist after Year 10. It will keep operating and generating cash, hopefully for many more decades. The Terminal Value captures all the cash the company will generate beyond Year 10.
The formula for Terminal Value is this:
TV = (FCF of Year 10) * (1 + G) / (D – G).
For the terminal growth rate (G), I use a conservative 5%. My suggestion is to keep this between 3 and 5%. Do not be aggressive here. Using our Year 10 FCF of Rs. 258 crore, with a terminal growth rate of 5% and a discount rate of 12%, the calculation gives a Terminal Value of approximately Rs. 3,850 crore.
TV = 258 * (1+0.05) / (0.12 – 0.05) = Rs. 3,850
But this Terminal Value is a future number too. So I discount it back to today using the same logic:
PV = TV / (1+D)^(Year)
PV of TV = 3850 / (1+0.12)^10 = Rs. 1246……..(2)
- Sub-step E(v): Add it all up and divide by shares outstanding.
- The total intrinsic value of the business equals the present value of 10 years of FCF (Rs. 948 crore) plus the present value of the Terminal Value (Rs. 1,246 crore). That gives us ₹2,194 crore as the total intrinsic value of the company.
Total PV = 948 + 1246 = Rs. 2,194 Crore
Now, to get the intrinsic value per share, I divide Rs. 2,194 crore by the total number of shares outstanding. If the company has 100 crore shares, the intrinsic value per share is Rs. 21.94.
Step 3 – Comparison
I then compare this with the current stock price. If the stock is trading at Rs. 30, it is overvalued.
If the market cap is Rs. 3,000 crore, it is more than the estimated intrinsic value of Rs. 2,194 crore. So again we can say that the stock is overvalued.
If the stock is trading at Rs. 18, it looks undervalued. That comparison is the conclusion of Step 2.
Applying the Margin of Safety
Knowing the intrinsic value is necessary, but it is better to keep a factor of safety.
The DCF calculation involves assumptions.
- I am assuming a certain growth rate for the next 10 years.
- I am assuming a discount rate.
- I am assuming a terminal growth rate.
Any or all of these assumptions can turn out to be slightly, or sometimes significantly, off from reality. This is nothing to be ashamed of. Even Warren Buffett can make mistakes in these assumptions for his companies. The future is genuinely uncertain.
Warren Buffett’s mentor, Benjamin Graham, dealt with this uncertainty through a concept he called the Margin of Safety. The idea is simple. Even after calculating your intrinsic value, do not buy the stock at that price. Build in a cushion (a buffer) that protects you in case your assumptions are wrong.
I explain this with the analogy of a bridge.
- Suppose an engineer builds a bridge with a capacity of 12 tons.
- But the maximum truck allowed on that bridge is only 7 tons.
- That 5-ton gap is the margin of safety.
Even if the engineer’s calculations had a small error, the bridge does not collapse. The gap provides protection.
The same logic applies to stocks.
Suppose my DCF calculation gives me an intrinsic value of Rs. 100 per share. A margin of safety of 25 percent means I will only consider buying this stock if the price is at or below Rs. 75.
If my assumptions were correct and the intrinsic value is truly Rs. 100, I have bought at ₹75, a built-in upside of 33%, just from the entry point. If my assumptions were slightly optimistic and the real intrinsic value is Rs. 85, I am still okay, as I bought at Rs. 75, so I am not in the red.
This way, the margin of safety does its job.
What if the stock is a good business but is currently trading above the margin-of-safety price?
The answer is simple: do not buy. Add it to a watchlist. Keep monitoring.
These are high-quality businesses we are talking about. They will have their bad quarters, their sector downturns, their moments of market-wide panic. When those moments come, the price often falls significantly, and that is when the margin-of-safety price becomes achievable.
Conclusion
The full process looks like this.
- You start with 5,000-plus listed stocks. You run them through the five filters. ROCE above 15%, consistent EPS growth above 10%, low debt (D/E below 0.3 to 0.5), positive and growing free cash flow, and a reasonable P/E relative to history and peers. After applying all five filters, you will typically end up with about 10 to 15 quality businesses.
- For each of those businesses, you run the DCF calculation. This gives you the intrinsic value per share.
- Then you compare that intrinsic value with the current market price, after applying a 25% margin of safety. If the stock is trading below the margin-of-safety price, it goes on your buy list. If it is not, it goes on your watchlist.
Have a happy investing.