Is Silver Overvalued in Today’s Times?
In the last 1 year, the price of Silver (Example: Nippon India Silver ETF) has gone up by 126% (from Rs. 84 to Rs. 192). The way we can judge the Index’s valuation by looking at its historic P/E ratio, is there any way we can judge the valuation of Silver ETF?
Unlike equity (Stocks or Indices), silver (or a silver ETF) does not have cash flows, profit, or a balance sheet.
So there is no metric like a P/E ratio for investments like Silver or Gold.
Hence, it becomes tough for us to tell whether silver is “cheap” or “expensive” in a precise valuation sense.
Even in the case of silver ETFs, they are simply an instrument that tracks the spot price of silver. Its price simply reflects what the market is willing to pay for silver at that point in time. There is no way we can double-check the market price based on a reference profit or cash flow numbers (like in case of equity).
Hence, these asset types (like Silver or Gold) do not generate any intrinsic value for themselves.
But silver can still be judged on a relative and cycle-based basis.
Common tools include the following:
- Looking at long-term price charts adjusted for inflation.
- Comparing current prices with historical ranges, and
- Using ratios such as the Gold-to-Silver ratio.
I like the use of the Gold-to-Silver ratio to judge Silver’s price valuation. For example, I’ve create the below Silver-to-Gold price table and its ratio chart.
| Year | Gold (Rs./10gm) | Silver (Rs./Kg) | Ratio |
| 2025 | 1,35,300 | 1,99,100 | 1.47 |
| 2024 | 78,250 | 95,700 | 1.22 |
| 2023 | 65,330 | 78,600 | 1.20 |
| 2022 | 52,670 | 55,100 | 1.05 |
| 2021 | 48,720 | 62,572 | 1.28 |
| 2020 | 48,651 | 63,435 | 1.30 |
| 2019 | 35,220 | 40,600 | 1.15 |
| 2018 | 31,438 | 41,400 | 1.32 |
| 2017 | 29,668 | 37,825 | 1.27 |
| 2016 | 28,624 | 36,990 | 1.29 |
| 2015 | 26,344 | 37,825 | 1.44 |
| 2014 | 28,007 | 43,070 | 1.54 |
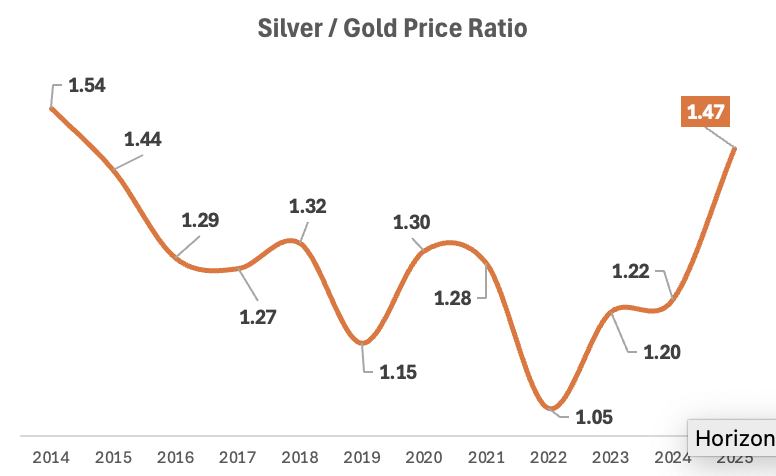
You can see, in the last 11 Years, the average Silver-to-Gold price ratio was about ~1.3. But in 2025 and in 2014, the ratio was 1.47 and 1.54, respectively. These numbers do indicate that, currently, the silver price seems overvalued.
These types of ratio comparisons are not valuation tools like P/E, but they help in understanding where silver stands in its historical cycle.
What’s critical for us investors to know about Silver?
- Silver prices are driven mainly by macro factors. Factors like global liquidity, inflation, interest rates, currency strength, and equity performance influence the Silver price. So, a sharp rise like 126% up in 12 months often reflects a mix of these factors rather than the fundamentals of Silver changing overnight. It means people start buying silver due to other surrounding factors.
So, how should we equity investors think about silver investing?
We should treat Silver (and Gold) as tools to manage our investment risks (due to equity exposure) instead of thinking of them as investments in themselves. So, it is needless to worry about its valuations. For sure, if the Silver-to-Gold ratio shows us that silver is trading at above-average multiple, in such times we should hold our buy calls.
